Most of what is written about business capability modelling comes from someone selling it: a tool vendor, a framework body, a consultancy. This report instead reads three kinds of evidence against each other: what employers ask capability people to do (99 individually coded job postings), what the tools claim and can demonstrate (eleven vendors' own documentation and customer stories, coded claims against evidence), and what the published reference models actually contain (20 model families, from MITA 2006 to the current SAP catalogue). Together, the three records answer what the state of business capability modelling actually is: not what the discipline says about itself, but what it writes down when hiring, selling, and standardising.
The short version: the market sells a management discipline and buys a drawing. Two decades after the first capability-mapping papers, half of all capability hiring stops at producing the map, the measurement loop the tool vendors advertise is asked for in one posting out of 99, and across every vendor coded for this study, 2010 through 2026, not one shows a named customer with a quantified outcome that ran through a capability model.
Capability Maturity: How to Assess What Your Organisation Can Actually Do makes the argument this evidence supports: that the value starts when you score the map and act on the scores. This report is the evidence; that pillar is what to do about it.
The six findings that matter most
Each finding below is one face of the same gap: what gets sold, against what gets bought.
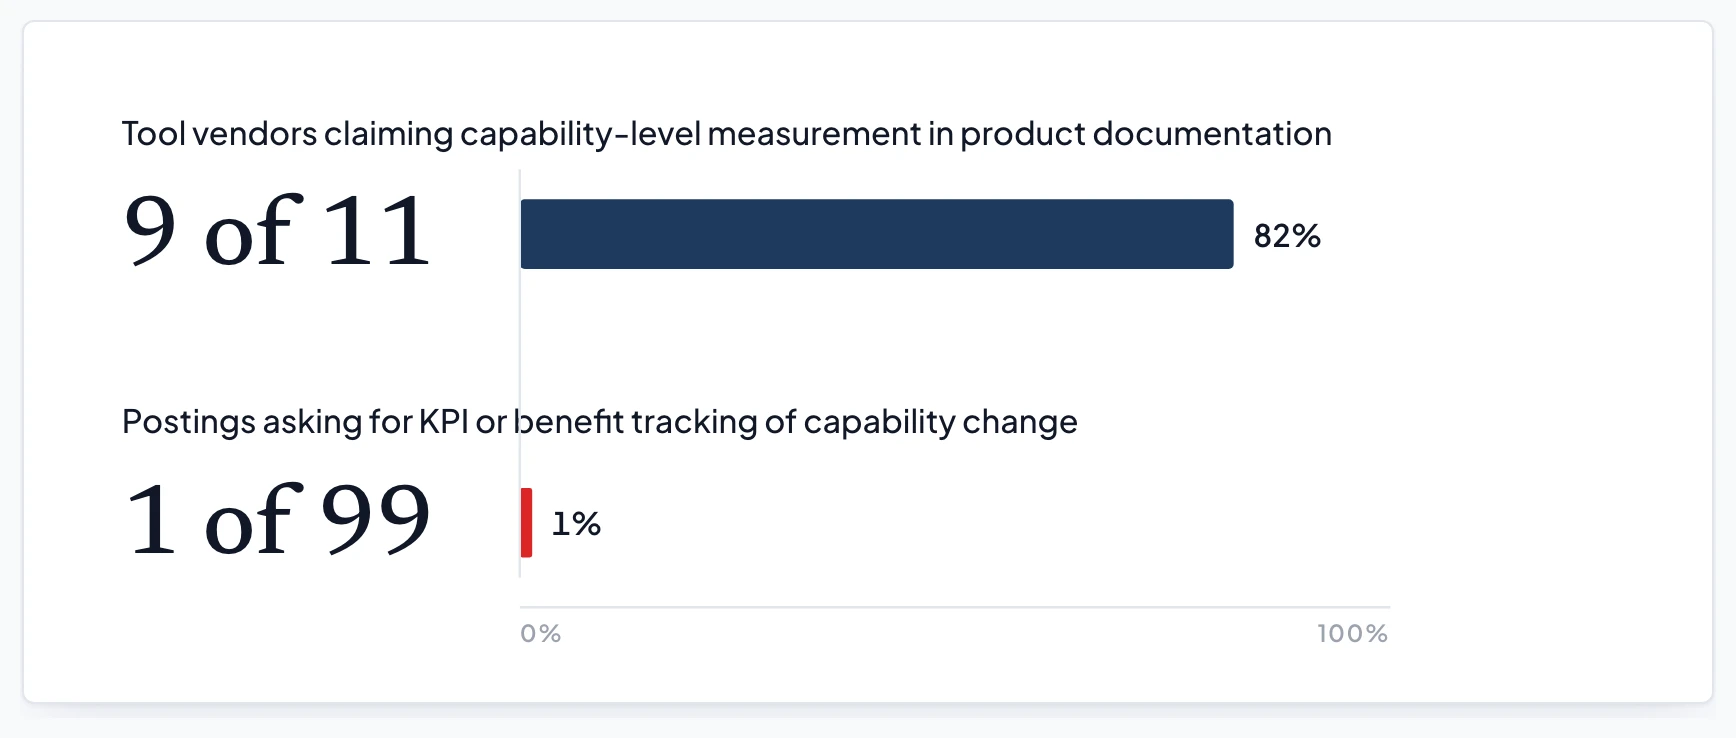
- Vendors sell a stage one hirer in 99 buys. Nine of eleven coded tool vendors claim capability-level measurement or KPI feedback. One posting in 99 asks for it. The gap between the product page and the job description is the defining feature of this market.
- Half the market stops at the map. 81% of capability-substantive postings (those where the capability construct does real work in the text, not an incidental mention) ask someone to create or maintain a capability view; 28% ask for assessment, 27% for connecting the map to anything else, and 11% for any named decision made with it. 54% assign no capability responsibility beyond the view itself.
- No vendor coded for this study shows a named, quantified, capability-driven decision, in 2026 or in 2010. Customer evidence splits into names without numbers and numbers without names, and the one case that is both named and quantified (IBM's $900K-a-month application clean-up on ServiceNow) contains no capability model at all: ownership data and configuration-management hygiene did the work.
- The ladder is a pyramid, not a staircase. Postings that assess and decide without formally connecting the map outnumber the full map-assess-connect-manage stack seven to three. Organisations jump from capability gaps to investment decisions, skipping the integration layer the tools are built to sell.
- Nobody agrees how deep a capability map goes, and nobody asks. Across vendors and frameworks this study counted seven distinct positions on capability levels, from "5 to 10 at Level 1" to "between three and six levels" to a hard-coded six-level schema. One posting in 99 states a level count at all. The most adopted public capability catalogue carries 33 Level 1 capabilities against the leading vendor's advice of 5 to 10.
- Producing a map now costs nothing; maintaining one is almost never funded. Free tools and bundled starter maps have commoditised map production, while only 4 of 20 public reference models show real change control, and hiring language reflects the same neglect: maintenance language appears in 21 of 99 postings, stewardship in 4.
What hirers actually ask capability people to do
Each of the 99 postings (89 Business Architect and 10 adjacent-role postings, every one hand-confirmed as making substantive use of the capability construct) was coded for four stages of capability work, at responsibility level, with a strict evidence rule: no quote from the posting, no code.
State of Capability Modelling · stage signals, n=99
Half the market stops at the map
The share of capability-substantive postings asking for each stage of capability work, coded at responsibility level with a strict standard for Manage.
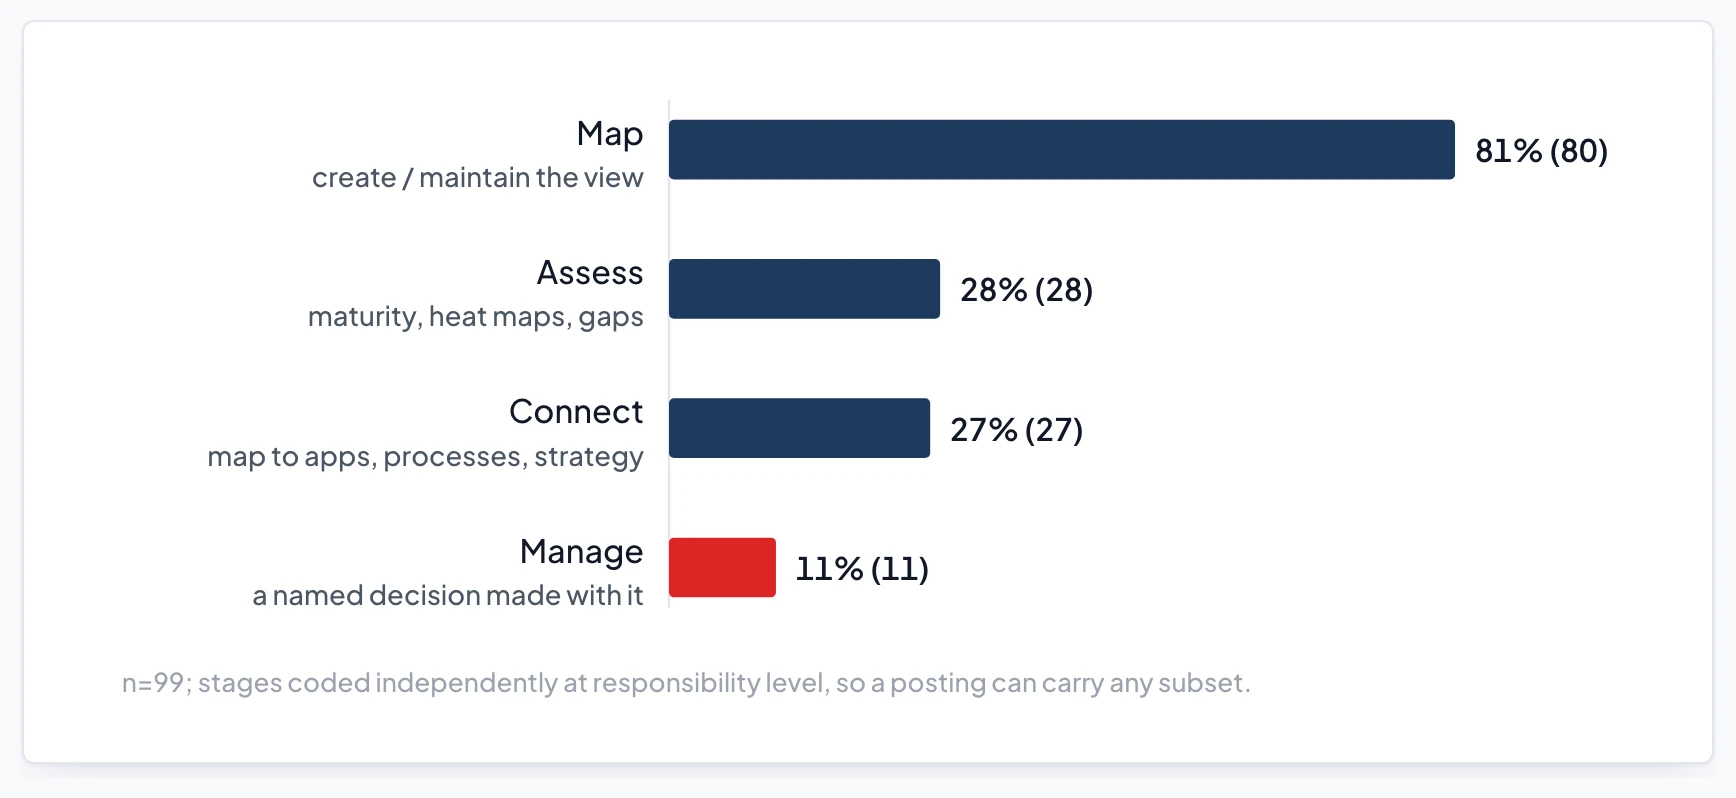
Profile view: 41 of 99 postings are Map-only at responsibility level, 8 use capability purely as language with no capability work at all, and 4 demand capability expertise while assigning no capability accountability whatsoever. Those three groups sum to 53 of 99: 54% of capability hiring assigns no responsibility beyond the view itself. That is the job the hiring record describes behind a lot of architect titles: hired as an architect, funded as a cartographer. The attrition from 81% to 11% looks like a ladder, but the profiles say otherwise: seven postings assess or connect a view someone else maintains, and the Manage-without-Connect profile (map, assess, decide) outnumbers the full stack 7 to 3. The market treats the formal capability-to-application mapping layer, the heart of the EA tool value proposition, as optional on the way to a decision.
State of Capability Modelling · named decision uses, n=99
Capability work points money, and rarely checks the pointing worked
Where postings name a decision the capability view feeds, this is what they name.
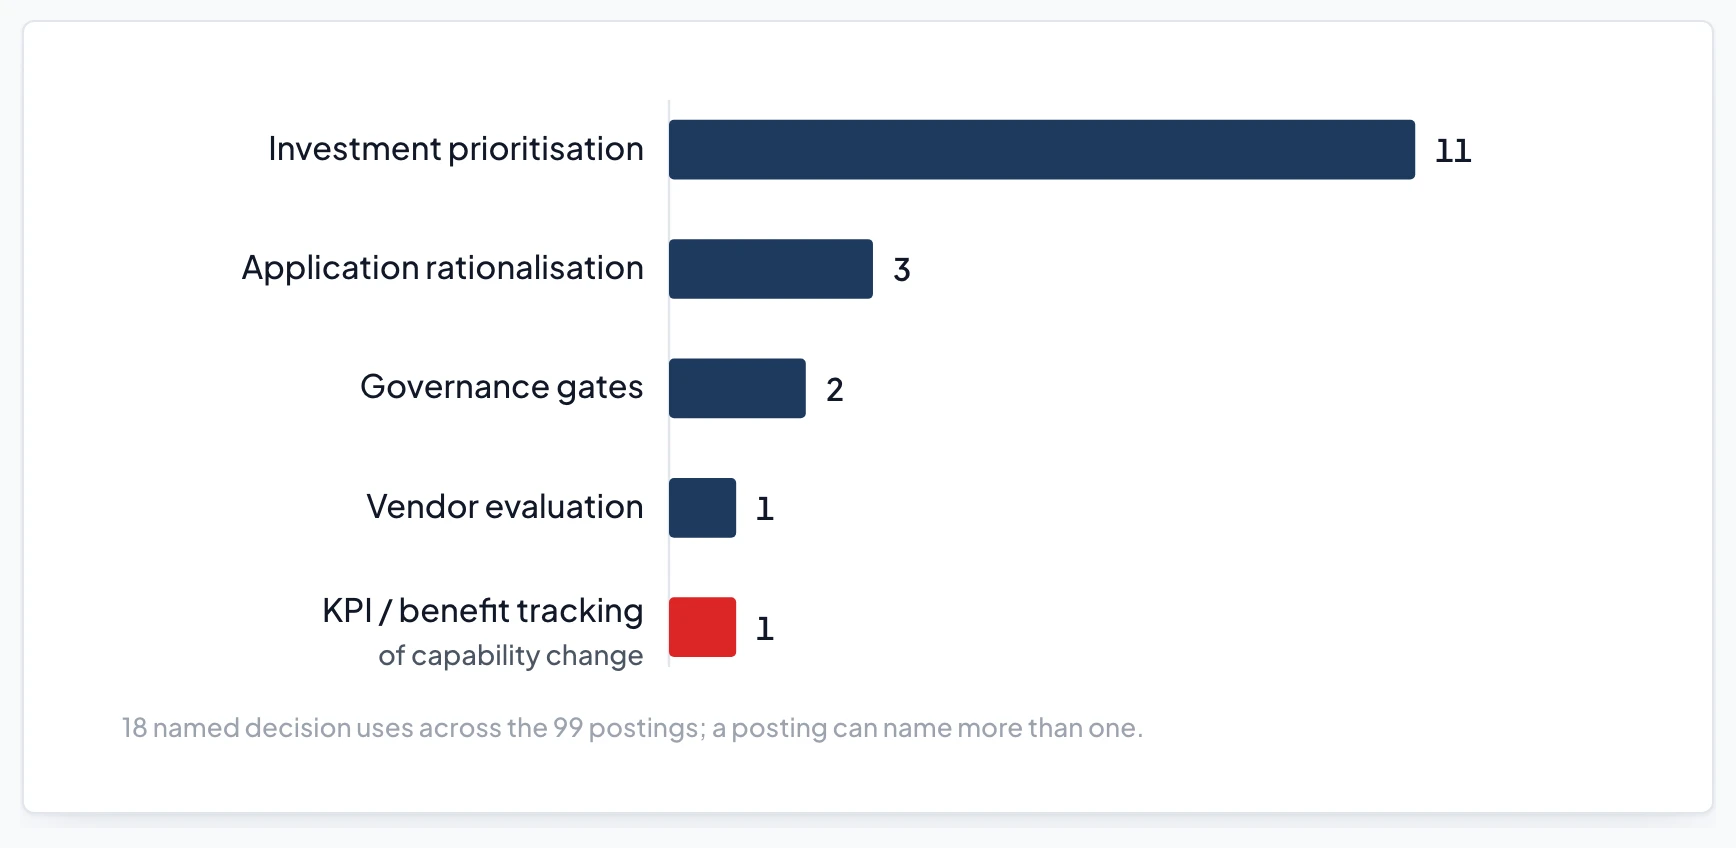
The market buys capability work overwhelmingly to direct spending, almost never to check the spending made a difference. The artefact language matches: map 46 mentions, model 23, roadmap 15, heat map just 2, and tooling is named in a handful of postings despite an entire industry selling it.
These rates measure what postings say, not what jobs involve day to day, and they are floors: the full self-audit record is in the methodology section.
What the vendors claim, and what they can show
Each vendor was coded three ways, kept strictly separate: what the product documentation claims a capability model is for, what published customer stories actually demonstrate (vendor-selected and success-biased, which cuts in the vendors' favour), and never the two pooled. Eleven vendors were coded (SAP LeanIX, Ardoq, Bizzdesign, Orbus, Avolution, Sparx, ServiceNow, Planview, SAP Signavio, BOC ADOIT, Valueblue BlueDolphin): the study's list had twelve slots; coding found that two of the listed vendors had been absorbed by competitors, one slot was refilled with a replacement, and eleven vendors ended up coded. A 2010 Troux deck serves as the long-range comparator.
The claims are near-unanimous. Nine of the eleven suites claim the full ladder, including the measurement loop: LeanIX ("assign key performance indicators to better measure and monitor performance"), Ardoq ("measuring the success of change projects"), Bizzdesign, whose Map-Assess-Plan-Control cycle is the product frame ("monitor and steer those capability improvements based on strategic KPIs"), and on through the list. Set against one hirer in 99 asking for that loop, this is the market's central disconnect.
State of Capability Modelling · claims vs hiring
The market sells a stage one hirer in 99 buys
Capability-level measurement, as claimed in vendor product documentation and as asked for in the hiring record, on the same scale.
The evidence is not. Across every vendor coded, customer proof splits into exactly two genres:
State of Capability Modelling · every coded customer proof, 2010–2026
The empty quadrant
Every customer proof coded in this study, placed by whether the customer is named and the outcome quantified, colour-coded by vendor. The quadrant the pitch needs holds one case, and it contains no capability model.
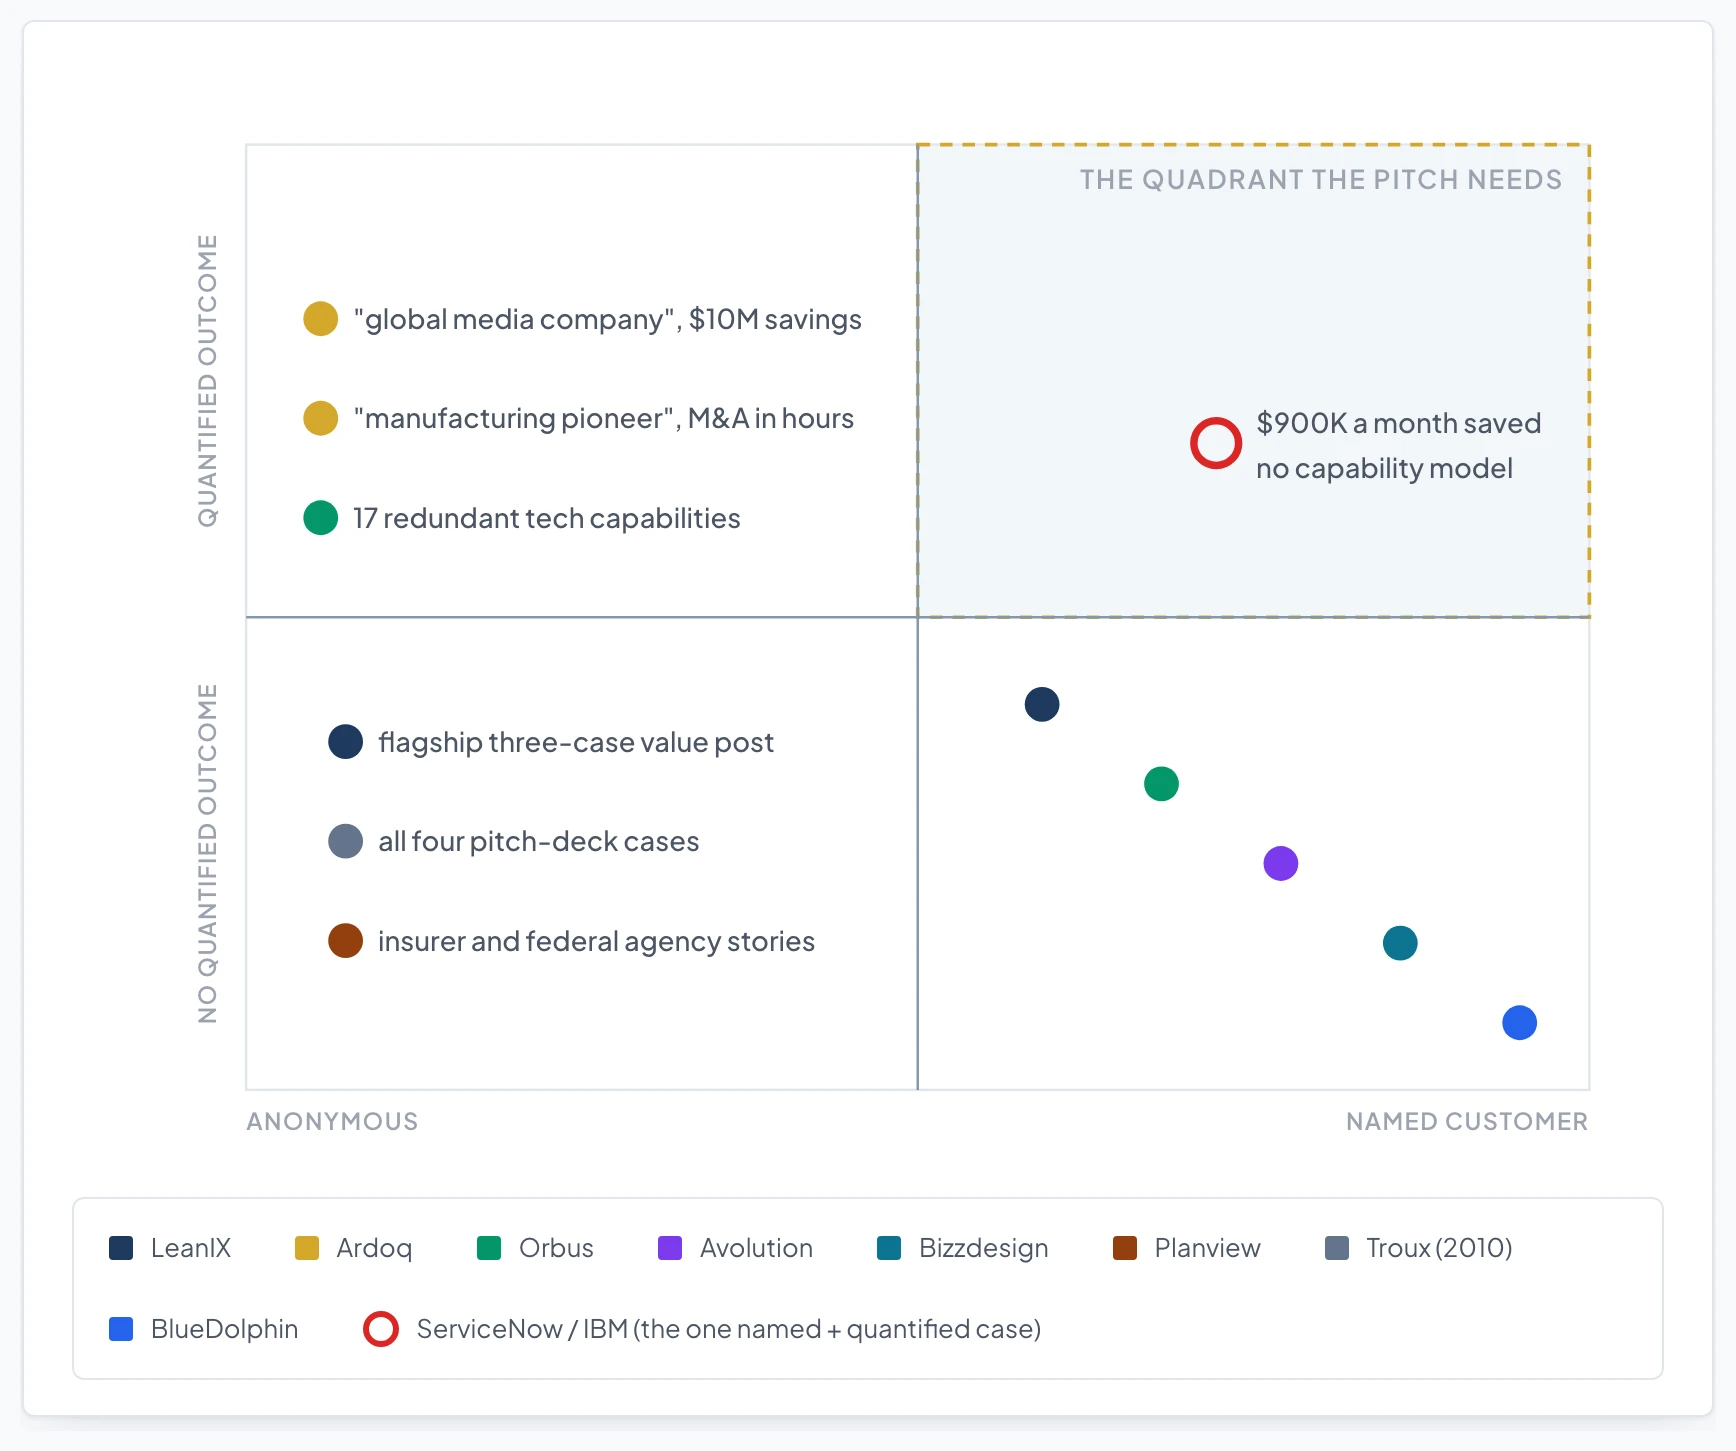
The 2010 Troux deck in this study's source collection shows the identical pattern sixteen years earlier: the full-ladder pitch ("Establish and manage KPIs"), reference models already bundled, and four case studies named "Large Manufacturer," "Financial Services," "Banking," and "Insurance." Sixteen years of capability-map marketing, same claims, same anonymity.
The nearest miss proves the point from the other side. ServiceNow's Enterprise Architecture page carries a genuinely named, genuinely quantified story: IBM saved nearly $900,000 a month by sunsetting roughly 20% of its applications. Read in full, the case contains no capability model. The mechanism was accurate application ownership (an org-chart integration), a cleaned configuration database, and lifecycle controls. The one real, named, quantified rationalisation outcome in this entire corpus did not need the artefact the market sells for exactly that purpose.
The strongest defence of the vendors is confidentiality: enterprises rarely let suppliers publish their internal decisions with numbers attached. The IBM case is why that defence fails here. The genre plainly does publish names with numbers when it has them; the anonymity in the capability stories is selective, and it is selective exactly where the capability model would have to carry the result.
Two more structural facts from the vendor pass. First, consolidation keeps shrinking the field: Capsifi, the one business-architecture-native vendor on the list, went to Orbus (December 2024), and MEGA and Alfabet went to Bizzdesign (2025). The business-architecture-first propositions are being bought into IT-side platforms, which mirrors where the hiring sits. Second, the methodologically richest claim in the market, Bizzdesign's capability-based-planning whitepaper by ArchiMate's lead designer, demonstrates its complete loop on ArchiSurance, The Open Group's fictitious insurance company.
What the reference models reveal
Twenty public model families were coded on a structural scheme: what the model is actually made of, how it levels, what assessment apparatus it ships, and whether anyone maintains it.
The reference models that won adoption are not capability models. APQC's PCF is processes (13 categories, 1,000+ processes, and its category 13.0 is literally titled "Develop and Manage Business Capabilities," meaning cross-cutting management processes). TM Forum's eTOM is processes. BIAN's primary artefact is a landscape of service domains (322 at version 11), with a business capability model added only recently "to present a more business-focused view." Canada's government reference models are programs and services with no capability layer at all. IT4IT is value streams. Where capability catalogues exist in these lineages they are the newest stratum, typically added as a navigation overlay for business stakeholders: CAUDIT's higher-education catalogue in 2018, BIAN's overlay, SAP's corporate capability model shipped as catalogue content inside its own tools.
There is a second, older capability lineage, and it works backwards from assessment. The US Medicaid IT Architecture (MITA) had the complete modern pattern in 2006: a business capability matrix, a five-level maturity model, and a state self-assessment, built by a public agency for funding alignment. In that framework a capability is defined as a business process at a specific level of maturity: the capability is the maturity statement. The same instrument shape reappears in US healthcare reform models and again in higher-education research computing (CaRCC, 2019 to present, now a live benchmarking portal): questions, scales, weighted rollups, peer comparison, and in CaRCC's case no capability map at all. Where the business-architecture lineage treats the map as primary and assessment as the next step, this public-sector lineage ships the assessment and treats the map as optional. Both lineages are visible in the hiring data.
The word itself never settled. Across the coded artefacts, "capability" means seven different things: a process at a maturity level (MITA), a heading for management processes (APQC), a higher-level unit that decomposes into processes (ACORD), a business component (IBM), an assessed area of support practice (CaRCC), a stable noun-named ability (BIZBOK, CAUDIT, every modern tool), and a military-planning ability-to-achieve-an-effect. The field fought this out publicly between 2011 and 2014, down to an Open Group workshop titled "The Capability Conundrum," and ended without a verdict. The job-posting evidence shows what "went quiet" looks like: hirers use the vocabulary generically and never name a framework edition.
State of Capability Modelling · prescribed map depth
Seven answers to a question hirers never ask
How deep a capability map should go, according to the suppliers, the frameworks, and the catalogues.
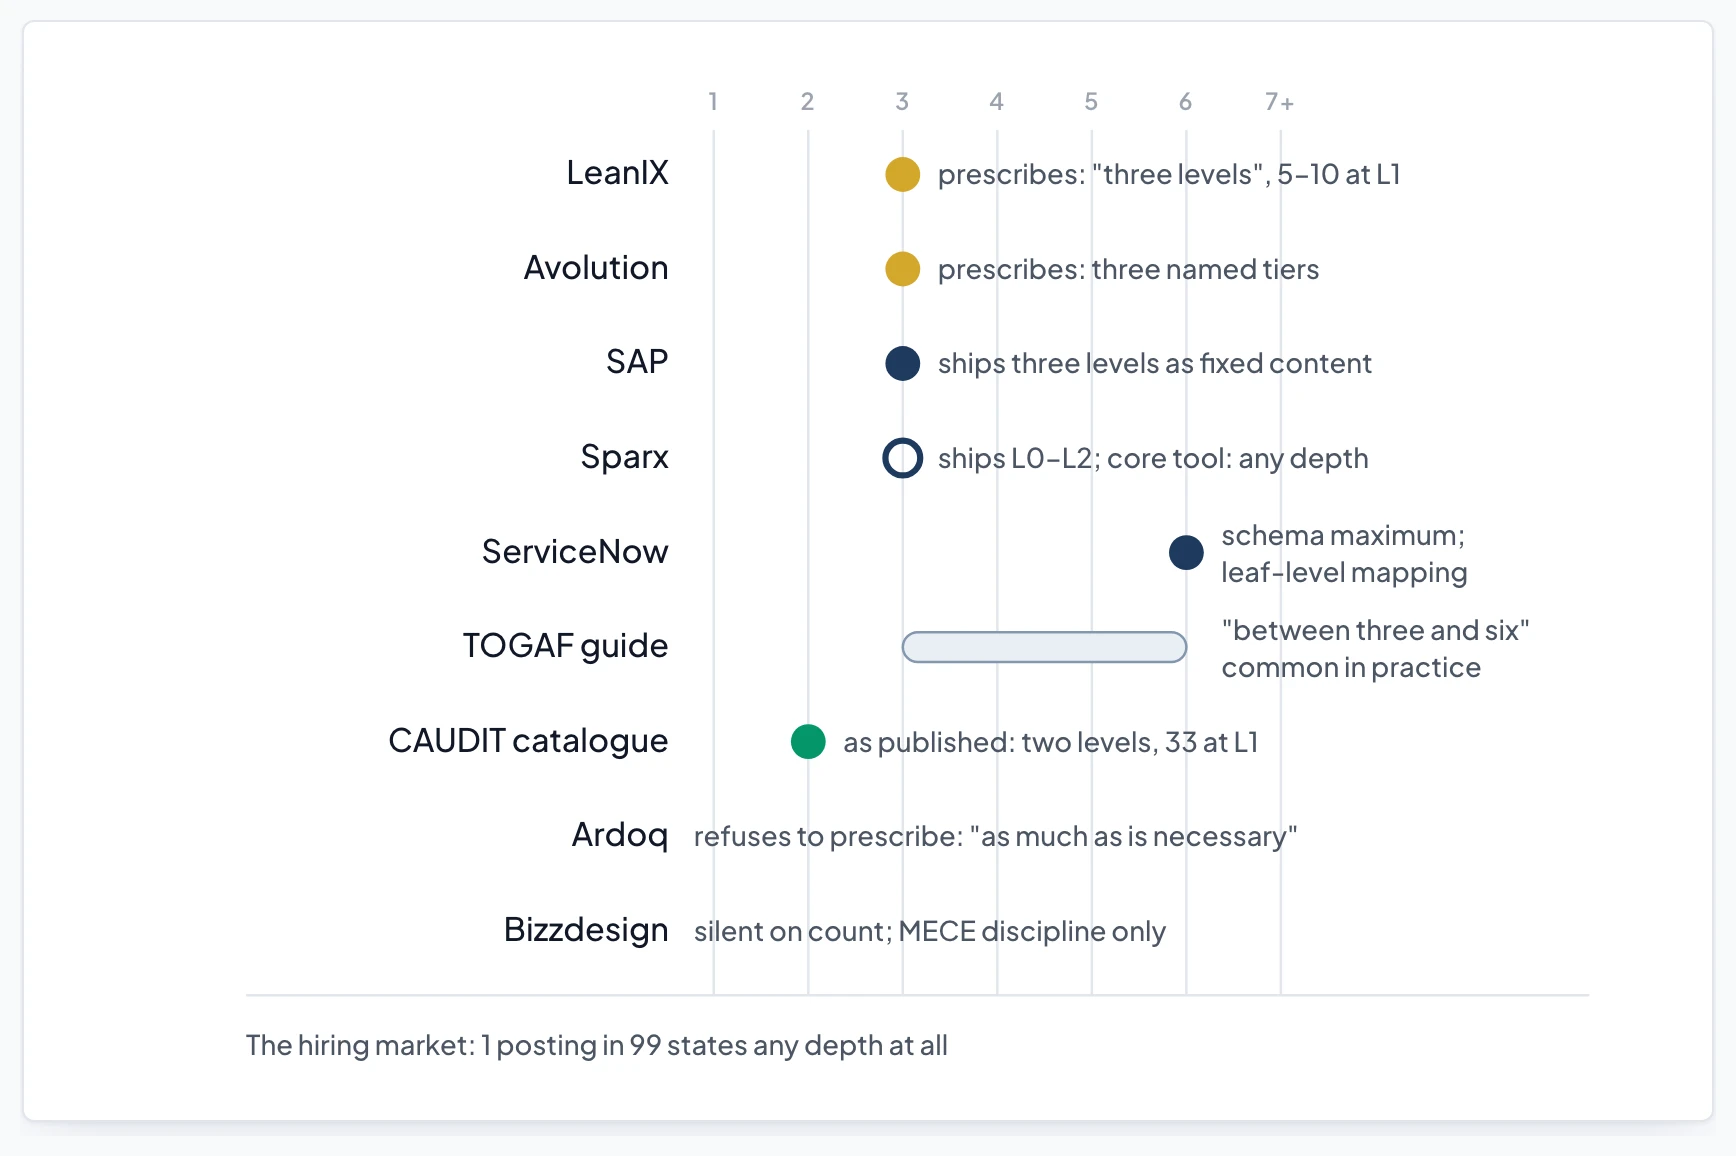
Granularity, specifically, is chaos nobody notices. LeanIX prescribes "5 to 10 critical capabilities" at Level 1 and three levels of depth. Ardoq explicitly refuses to prescribe. Avolution names three tiers. ServiceNow's data model allows six. SAP ships its model at three levels as fixed content. The TOGAF Business Capabilities guide says "between three and six business capability levels of decomposition is common in practice", and pictures a map as "a collection of 20 to 30 capabilities", siding with the catalogues against the vendors on breadth. And the most widely adopted public capability catalogue coded here, CAUDIT's, publishes 33 Level 1 capabilities in two levels. The suppliers disagree with each other, the frameworks disagree with the suppliers, the catalogues disagree with both, and the postings almost never raise the question: one in 99 states a depth at all.
Maintenance is the discipline's biggest unfunded assumption. Every framework treats the capability model as a curated, long-lived asset. Among 20 coded model families, real change control is visible at exactly four: APQC, CMS, CaRCC, and CAUDIT (the only capability catalogue in the set with a published change log). The hiring side matches: maintenance language in 21 postings, stewardship in 4, and the strongest stewardship posting in the corpus ("steward of the Business Capability Model… authoritative, governed view") is a one-off.
The synthesis: the artefact stayed, the purpose moved
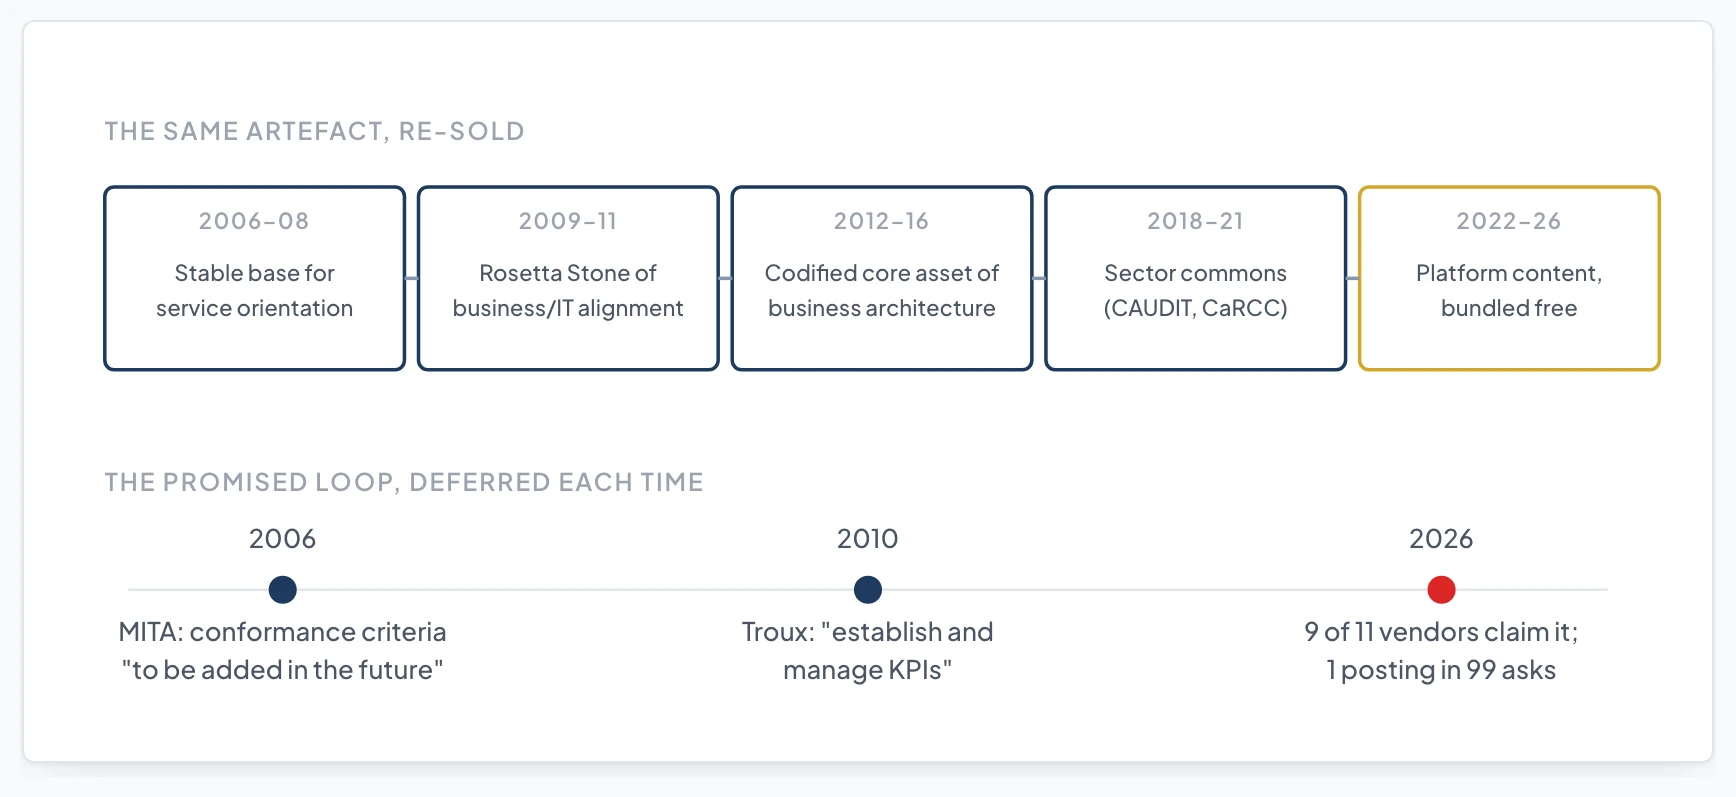
Read together, the three evidence streams tell one story. The same levelled, noun-named map has been re-sold four times: as the stable business layer for service orientation (2006), as the Rosetta Stone of business/IT alignment (2009 to 2011), as the codified core asset of business architecture (2012 to 2016), and now as entry-point content for planning-and-measurement platforms, bundled free, with the margin moved up-ladder. Each era kept the artefact, rewrote the purpose, and promised the loop-closing use next: MITA's conformance criteria were "to be added in the future" in 2006, Troux pitched "establish and manage KPIs" in 2010, nine of eleven vendors claim the loop today. The hiring market's profiles (Map-only, Assess-to-decide, Integrated, Language-only) read as those eras' sediments, coexisting.
State of Capability Modelling · 2006–2026
The artefact stayed; the purpose moved
Four re-sellings of the same levelled, noun-named map, over the same twenty years in which the loop-closing use stayed one release away.
That is also why the maturity question matters more than the mapping question. Map production is commoditised: the serious free tool exists, the whiteboard templates exist, SAP ships the map as inventory. Every remaining claim to value lives in the stages the market demonstrably under-buys: scoring the map honestly, connecting it to real portfolios, and closing the loop on whether capability investment worked. And the one place in this entire evidence base where that loop demonstrably runs is the lineage that worked backwards from assessment: MITA's capability self-assessments have been tied to federal Medicaid funding alignment since 2006, and CaRCC's benchmarking portal is live, community-run, and growing, both without waiting for a perfect map. The loop is not impossible. It is just not where the market has been told to look for it.
This reading is reasoned across the three coded streams; every figure behind it is measured and limited in its own section above. The evidence says the gap is not a tooling gap. It is a practice gap, sixteen years wide, with a working counter-example in public-sector plain sight.
Methodology, in brief
Postings. 99 capability-substantive postings were identified by a keyword screen plus hand-confirmation from a 161-posting Business Architect corpus and a 94-posting adjacent-role control sample (corpus methodology in the Business Architect role report). Each was coded for responsibility-level stage signals, artefact vocabulary, decision uses, ownership language, and tooling, under a no-quote-no-code rule and a strict Manage standard (a decision verb with the capability artefact as input). Single-coder, with a stratified 10-entry self-audit whose two corrections are reflected in all figures; rates are presence rates in posting text, and floors rather than ceilings.
Vendors. Eleven entities across twelve worklist slots, coded from product documentation and published customer stories in October 2026, with claims and shown evidence never pooled, every quote capture-dated, and "not found on pages checked" never coded as absence. Three pages that blocked automated access were read in full in a browser and verified verbatim. Vendor-published customer stories are success-biased by construction; this cuts in the vendors' favour, which strengthens the null finding.
Reference models and frameworks. Twenty public model families coded structurally from primary documents (a 117-file reference-model library assembled over two decades of practice, plus current-version captures), and a framework-assumptions comparison across BIZBOK, TOGAF, ArchiMate, SAFe, MITA, and the defence-planning lineage, quote-verified against primary or spec text except where noted in the source files. Licensed analyst material is cited, not reproduced.
What this means, depending on who's reading it
If you run an architecture practice: your capability map is table stakes and your differentiation is everything after it. The hiring record says 54% of capability postings ask for nothing past the map; the pillar this report supports shows how to score the map against what the strategy requires, and make the scores drive decisions. If your map has no owner and no change log, the reference-model evidence says it will quietly expire like most of its published cousins.
If you're buying a tool: you are paying for stages that, on the hiring record, almost nobody is staffed to run. Ask the vendor for one named customer with a quantified outcome that ran through the capability model, specifically. Across every vendor and customer story coded here, 2010 through 2026, this study found none, and the one named, quantified case adjacent to the space achieved its outcome with ownership data and a clean CMDB instead.
If you're hiring a business architect: the postings data says you are probably writing a mapping job and calling it a strategy job. If you want the decision loop, write it into the accountabilities: name the investment forum the capability view feeds, and fund the stewardship, because a posting that says "maintain" gets a custodian, and only 4 postings in 99 ask for a steward.
If you write about this field: the interesting question is no longer "what is a business capability map." It is why an artefact this cheap to produce, this contested in meaning, and this rarely connected to a verified decision has been re-sold four times and is still growing. The answer this evidence supports: because the map is genuinely useful as shared language, and shared language is the one benefit that never needed the rest of the ladder. The rest of the ladder is still worth climbing. The evidence for that is just not in the brochures: it is in the assessment-first instruments built to inform funding decisions and peer benchmarks, which is exactly where the companion pillar picks up.