You've sat through the reorganisation. A new org chart appeared on a slide, boxes moved, reporting lines were redrawn, and senior leaders explained the design with real conviction. Six months later, the work is done the same way, by the same people, for the same stakeholders, because the chart was never what was broken. The reorganisation is a reflex: the instinctive move an organisation makes when its strategy isn't gaining traction and it needs to be seen to act. It is also the change least likely to deliver the strategy. Of all the levers in an operating model, structure is the weakest, and a reorganisation pulls that lever first while leaving all the others untouched.
If you came looking for operating model examples, you'll find five below, each worked through from start to finish, across the public and private sectors. But the examples only make sense once the definition is clear, so let's start there.
An operating model is strategy put into practice. It is the set of explicit choices about how an organisation uses its people, processes, technology, information, facilities, and suppliers, so that the way work gets done actually produces the outcomes the strategy promised. It is the machinery that connects a strategic choice to a stakeholder who is measurably better off. Strategy names the destination. The operating model is the engine that gets the organisation there.
The best way to design that engine isn't through the org chart. It's through the service model. Organise the operation around the services it delivers, link each service's outputs to the outcome it exists to achieve, and the machinery becomes something you can see, measure, and improve. The service is where the claim "this output leads to that outcome" has to be made and tested, and the org chart has nothing equivalent. Reach for the org chart instead, and you rearrange the boxes while the engine that actually delivers value, the service operating model, stays exactly as it was.
A Quick Diagnostic
Five questions will tell you whether your operating model is doing its job, or whether it's just an org chart with ambitions. They take less than ten minutes.
- Can you name the design parameters your operating model was built to meet, or did the last redesign start with an org chart?
- Did the last change to your operating model shift anything other than structure, such as processes, information, decision rights, or capabilities?
- Can you trace a line from a stakeholder outcome back through a service to a capability? Or does the model deliver outputs without anyone being accountable for whether people are actually better off?
- Have you identified the handful of capabilities you absolutely must get right, and is the model built to excel at those rather than being "good enough" at everything?
- Who owns the decisions? Are decision rights and accountabilities explicit, or does the structure blur them?
If three or more answers are weak, what you have is a structure, not an operating model. The strategy-to-execution diagnostic traces the same break along the whole chain, from purpose through to outcomes.
Take the full diagnostic: Find Your Gap: 4-minute assessment →
What an Operating Model Actually Is
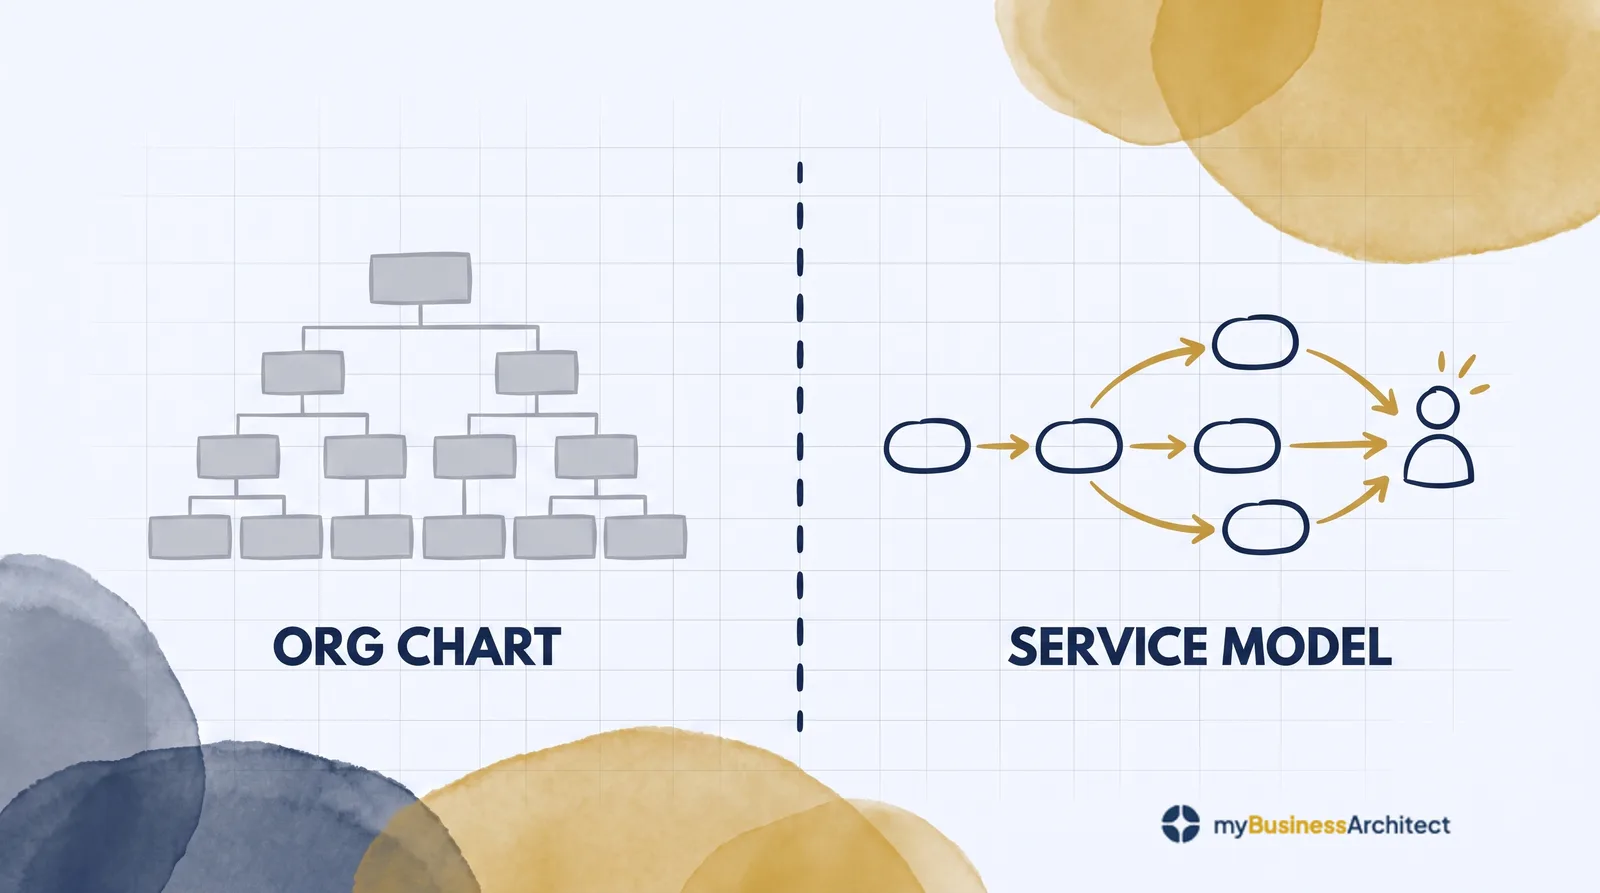 The org chart rearranges boxes; the service model carries the causal claim to outcome all the way to a person. Structure is the weakest lever an operating model has.
Remove the jargon from every serious source and the same definition remains. A strategy is a set of choices about where to compete and how to win. An operating model is what turns those choices into reality: the arrangement of capabilities, processes, information, technology, locations, and suppliers that converts intentions into day-to-day operations. The Business Architecture Guild says a version of this. So does the Bridgespan Group. So does every government target-operating-model exercise ever carried out. The definition isn't in dispute. What the field can't agree on is how to arrange the pieces, and that disagreement is where most operating-model work goes wrong.
The org chart is only one small part of an operating model. It belongs to the organisation-and-people domain, which is the least strategic of them all. Reporting lines show who answers to whom. They don't show how a stakeholder's request becomes a delivered result, which is the only thing an operating model exists to do. When leaders treat the org chart as the operating model, they mistake one part for the whole machine. They also reach for the lever, structure, that Bridgespan's own research identifies as the one that "rarely holds the key" to delivering a strategy. A reorganisation feels decisive because it's visible, and because it's one of the few changes a leader can order single-handedly. But it changes the picture without changing the work. Decision rights and accountabilities are different. They genuinely make a difference, but in a service model they belong to the services, not to the boxes on a chart. A better approach is available, and it has been hiding in plain sight inside the operating models that actually work.
Services put Capabilities to Work
Two words carry the whole idea. A capability is what an organisation can do: assess eligibility, manufacture a component, resolve a dispute, teach a skill. A service is how that capability is put to work to deliver value to someone. Capability is the what; service is the how. The formula is short enough to remember: develop capabilities, operationalise services.
That distinction shows where each half of the work sits, and why they are different jobs. Building a capability, realising it through people, processes, technology, and information, is one discipline. Turning it into a service that reaches a stakeholder to an agreed standard is another. Confuse the two and you get organisations that are sure they "have the capability" and equally sure that nothing is reaching the people they serve. The capability exists. It just never became a service.
Process is the hinge between the two. Processes use the resources a capability is realised through (people's skills, information, technology) and they deliver the service. So a capability is operationalised when its processes deliver one or more services, each producing something of value for a stakeholder to an agreed standard. One capability can be put to work in several services, and most services draw on several capabilities.
This is why the service model beats the org chart as the way to organise an operation. Boxes describe structure. Services describe how capability turns into value, and they carry the claim about which outcome they lead to. Organise the operation around its services and you can ask each one the questions that actually matter: What does this service produce? For whom? To what standard? Contributing to which outcome? At what cost? The org chart can't answer any of those. The service model is built to.
The Stable What, the Evolving How
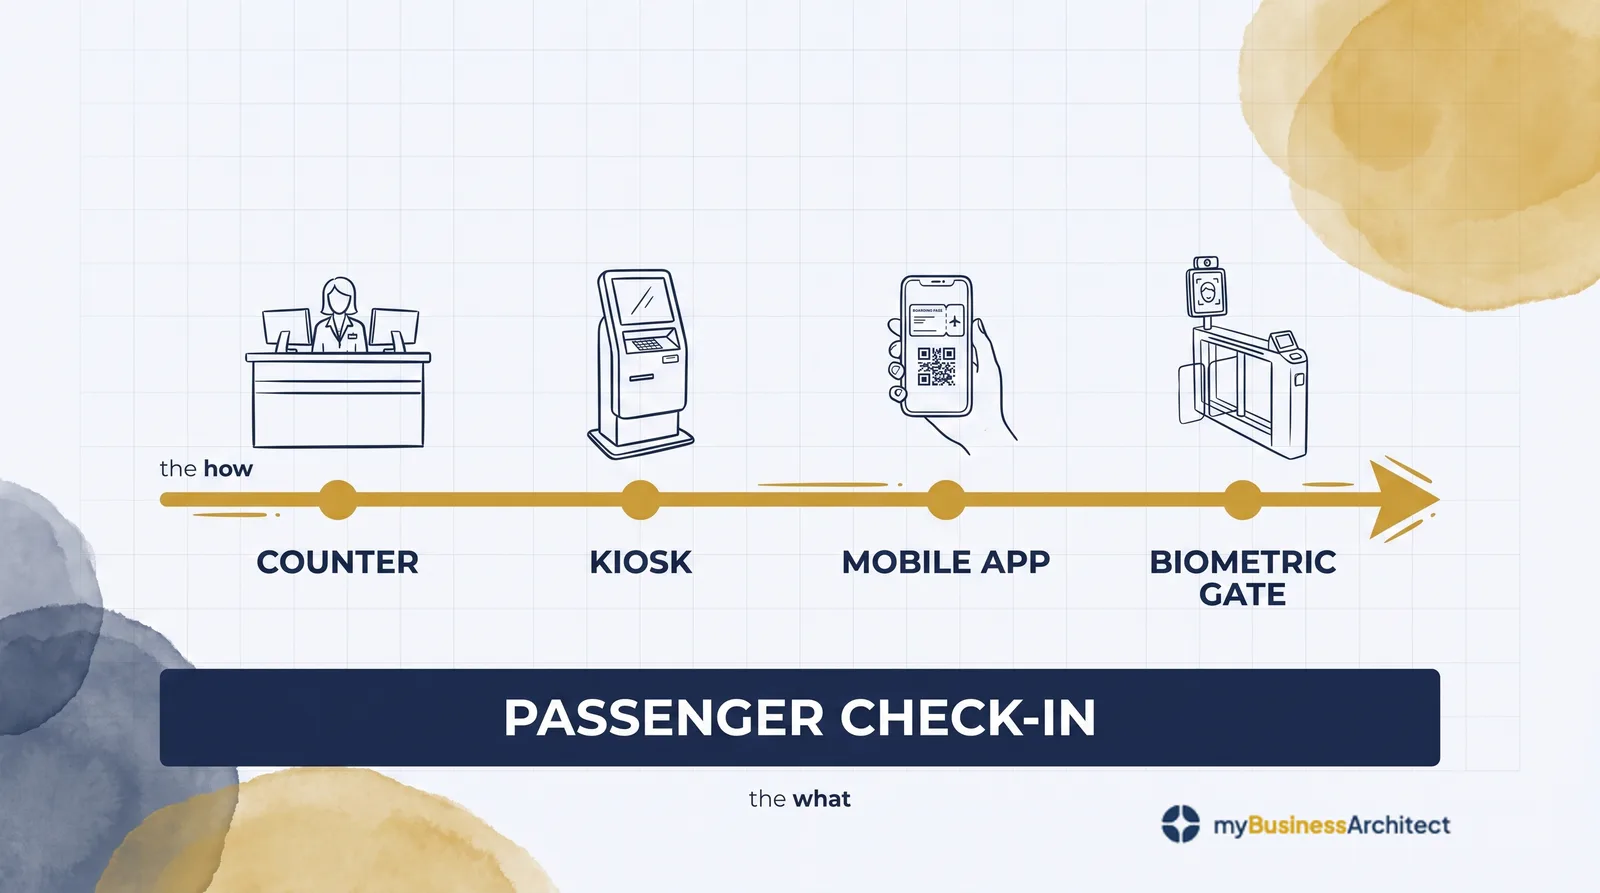 The what endures, the how is where you compete: one capability, its service re-operationalised from counter to kiosk to app to biometric gate.
Here is why the distinction is worth the effort. Capabilities are stable. Services are where change happens.
Take an airline. It has always needed a passenger check-in capability, and that hasn't changed in fifty years. What has changed beyond recognition is how the airline delivers it: first a manual, paper-based process at a counter, then a self-service kiosk, then an app that issues your boarding pass the night before while you're on the sofa, and now your face at a biometric gate. The capability stayed the same. The service, the how, transformed the customer experience, the cost structure, and the staff's working day all at once.
That is the general pattern. The what endures; the how is where you compete. Because capabilities are stable and services keep changing, advantage lies in how the service layer is set up, not in the list of capabilities, and certainly not in the org chart.
One caveat. A new how is only an advantage until competitors copy it, and every airline has an app now. So the edge doesn't come from owning a newer service. It comes from a combination of services that rivals can't easily match, and from the discipline of reinventing services faster than they can.
This also clarifies a phrase that gets used loosely. Done properly, "digital transformation" isn't about acquiring new capabilities, and it is certainly not a reorganisation. It's about reinventing how the organisation delivers the capabilities it already has. Artificial intelligence is the current driver of that reinvention: less a new capability than a dramatically better way of delivering existing ones. A reorganisation changes structure, the weakest lever. Real transformation changes services, the how, which is the lever that actually shifts the customer experience and the cost base.
Five Operating Model Examples
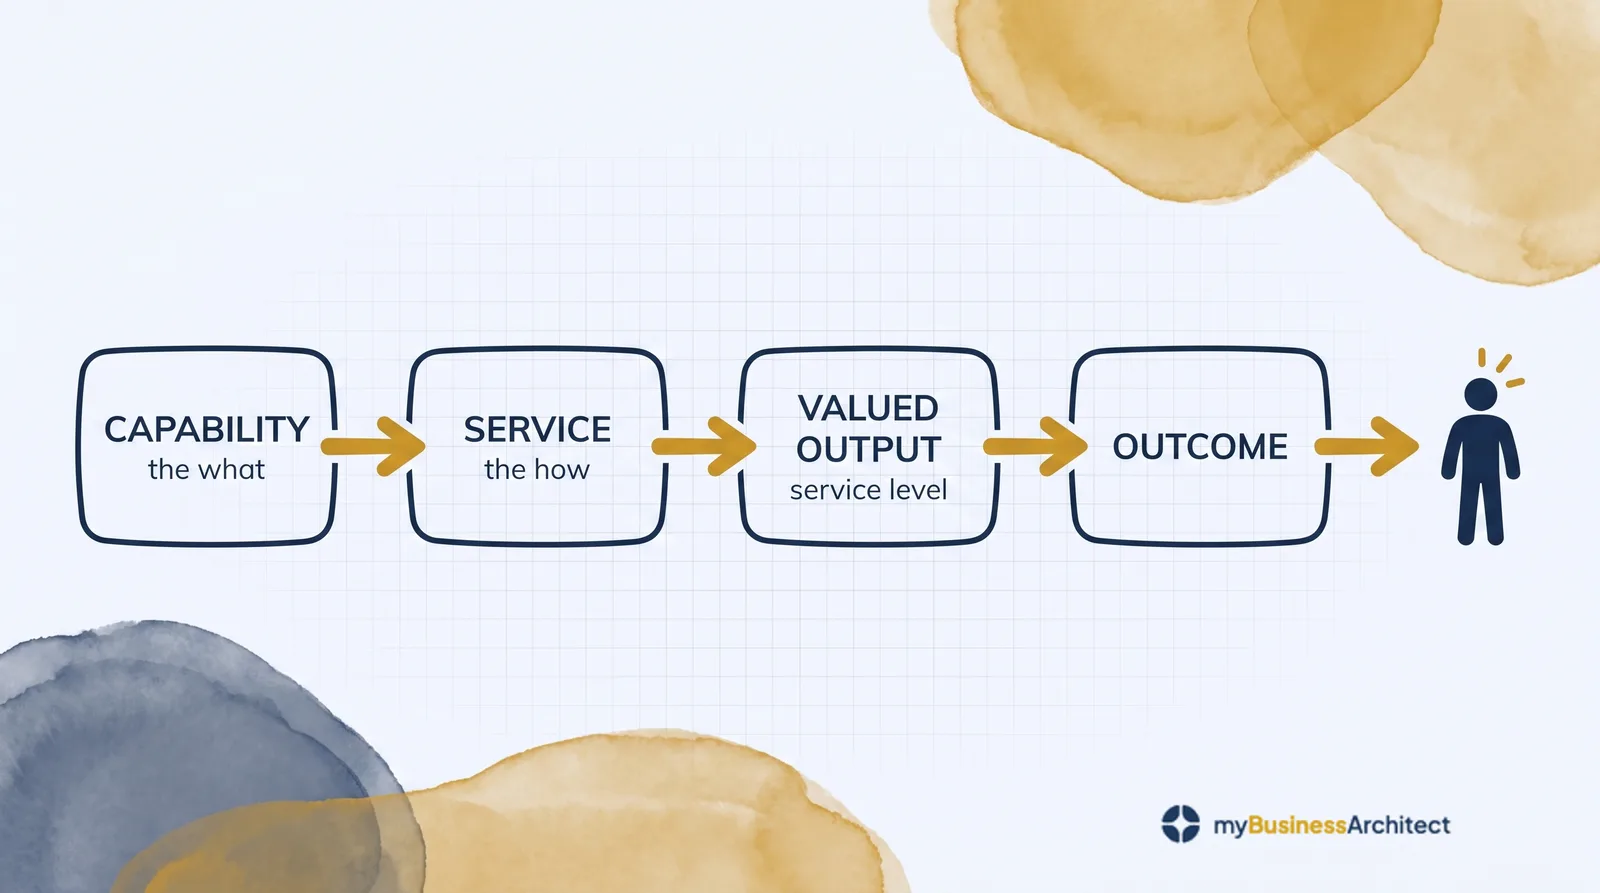 The lens applied to all five examples: capability → service → valued output and service level → outcome → a stakeholder measurably better off.
Operating models are easier to understand in concrete terms than in the abstract. Here are five examples from the public and private sectors, each viewed through the same service-oriented lens: the capability (the what), the service that puts it to work (the how), the valued output and its service level, and the outcome it contributes to. The lens applies everywhere; the sectors aren't the point.
1. Government human services: a childcare subsidy
John is a parent. He has just moved for a job that starts immediately, he has two pre-school children, and he can't afford childcare this month. He needs a subsidy quickly, without obstacles.
- Capability (the what): Eligibility Determination, Enrolment, Benefit Administration.
- Service (the how): a self-service subsidy. John opens an account online, enters his details, and the service does the rest. He never encounters the capabilities; he encounters a service.
- Output: an authorised subsidy, paid monthly to his daycare.
- Service level:
- Efficiency comes down to a real number. The same output costs the agency less than a dollar to process when John applies online, compared with roughly thirty dollars in person.
- Quality covers the rest: a decision that is timely and accurate, available around the clock, and completed without assistance.
- Outcome: John takes the job, and once his income is steady, his family no longer needs assistance.
His application is approved in time for him to start work, and his family makes rent this month. The reflexive response to "this department is too program-centred" is a reorganisation: move the subsidy team into a new division. That changes the boxes and nothing John experiences. The service model redesigned his experience (self-service, under a dollar to process, a timely decision, and a path off assistance once his income is steady) without touching the org chart.
Full case study: Redesigning a Government Operating Model Around the Citizen, Not the Programs traces one citizen through a real provincial human-services redesign, from three separate program entry points to a single citizen-centred service model.
2. An airline: passenger check-in
- Capability (the what): Passenger Check-in, unchanged for decades.
- Service (the how): a single check-in service, reinvented across four generations of channel and process: counter, kiosk, mobile app, and biometric gate.
- Output: a boarding pass and an assigned seat.
- Service level:
- Efficiency: the cost per check-in falls sharply as the channel shifts from a staffed counter to the passenger's phone.
- Quality: check-in takes seconds instead of minutes, and can be done from anywhere, a day in advance.
- Outcome: passengers board on time, and counter staff shift from processing everyone to handling the exceptions.
This is "the stable what, the evolving how" in its most literal form. No one rebuilt the capability, and the service still hands the passenger the same thing: a boarding pass and a seat. What they rebuilt, again and again, was how that service is delivered, and that is where every gain came from.
3. A retail bank: lending
- Capability (the what): Credit assessment and Loan Origination.
- Service (the how): a single loan origination service, reinvented from a branch appointment, to an online application, to an instant decision in the app.
- Output: an approved, funded loan.
- Service level:
- Efficiency: the cost of originating a loan falls sharply once it moves out of the branch.
- Quality: a decision in minutes rather than days, with risk judged as accurately or more so, available whenever the customer is ready.
- Outcome: customers get funding when they need it, and the bank grows its loan book at a lower cost to serve.
One capability, one lending service, three channels of increasing immediacy. The competitive difference isn't the capability, which every bank has. It's how the service is configured and delivered.
4. A hospital: chronic disease management
- Capability: Care Coordination and Diagnostics.
- Service (the how): a titration service, led by nurses or pharmacists, that adjusts a patient's medication between doctor's appointments instead of waiting for the next one.
- Output: an adjusted treatment plan that brings the patient back on target.
- Service level:
- Efficiency: the cost of each between-visit adjustment, weighed against the cost of the avoidable hospital admission it prevents.
- Quality: the time from a worrying reading to an intervention, and the accuracy of the adjustment.
- Outcome: patients' blood pressure is brought under control, and avoidable admissions fall.
The org-chart response would be to create a "chronic disease division." The service response is to design the service that actually reaches patients whose readings are drifting between visits. (This is the operating-model side of the OKR hypertension example: the key result names the outcome, and the service is what delivers it.)
5. A polytechnic: learner enrolment
- Capability: Admissions and Learner Assessment.
- Service (the how): a single apply-and-enrol service, reinvented from paper forms and in-person appointments to an online application with real-time eligibility checks and program placement.
- Output: an enrolled learner in the right program.
- Service level:
- Efficiency: the cost per enrolment falls as the service moves away from in-person processing.
- Quality: the time from application to offer, and the accuracy of placement, so each learner starts where they're most likely to succeed.
- Outcome: learners complete their programs and are ready for work, and the institution improves its retention.
Five sectors, one approach. In every case, the capability is stable, the service is where value is created or lost, and the outcome is what each service's outputs are ultimately tested against. The rule holds across all five: the service carries the link to the outcome, and the org chart never does. That is why the service model beats the org chart, and why the same lens works for a hospital, a bank, and a benefits office without needing to change.
Where the Operating Model Sits
The five examples share a structure, and that structure has a precise place. In the Design4 governance cycle, an organisation moves through four phases: Discover (purpose), Define (strategy), Develop (capability), and Deliver (operations). The operating model is the machinery of the last two. Develop builds the capabilities, the what. Deliver turns them into services, the how. The operating model is exactly that conversion of capabilities into services, running as live operations.
That doesn't make the operating model something that comes after strategy. It is part of strategy. The Strategic Choice Cascade from Lafley and Martin's Playing to Win has five choices, and the last two are the capabilities required and the management systems needed. Both are operating-model choices. So the cascade doesn't stop at strategy and hand over to someone else; its final two steps reach into the operating model. An operating model built on an "assumed" strategy has skipped choices that the strategist was supposed to make.
Each Design4 phase comes with a governance question, one of the Four Ares. Applied to the operating model, they line up neatly:
| Design4 phase | The Four Ares question | The operating-model question |
|---|---|---|
| Discover | Are we getting the benefits? | Do the service outputs lead to outcomes that make people measurably better off? |
| Define | Are we doing the right things? | Do the design parameters come from real strategic choices, or did the redesign start with an org chart? |
| Develop | Are we doing them the right way? | Have the required capabilities actually been built, in people, process, technology, and information, rather than just named on a chart? |
| Deliver | Are we getting them done well? | Are the capabilities working as services that produce valued outputs to an agreed standard? |
Read the right-hand column from top to bottom and you have the design for an operating model you can govern, not just draw.
The Measurement Layer: Outputs, Service Levels, Outcomes
Go back to John for a moment, because everything in this section is already in his example. It just needs naming.
His subsidy service does a series of things he never sees: it checks his eligibility, enrols him, and authorises the payment. Then it gives him the one thing he actually came for, a subsidy that is approved and paid to his daycare. That is the valued output. Every service has one. A training service produces a trained person, a lending service a funded loan, and John's service a paid benefit.
The output is also where the promise to the user sits. John was promised a decision that is quick, correct, and available whenever he can get to a screen. Write that promise down and it has a name, the service-level agreement, and the output is where you measure whether the service kept it.
Services also link together. John's approved subsidy becomes the input to the payment service that pays his daycare, and the daycare's own enrolment service takes over from there. The work moves across these services, each output feeding the next, and that chain is the operating model. It isn't a stack of boxes reporting upwards. It's a line of connected services all pointing toward John. That is the deepest reason the org chart is the wrong picture: work flows across services, never up and down reporting lines.
(For the architects: the end-to-end flow of work that delivers each service is the value stream. Services and value streams are complementary, not competing ideas. Lead with the service, because that's what John experiences and what its output carries the service level, and let the value stream describe how the work flows behind it. How to measure a service goes deeper.)
Outputs aren't the end of the story, and treating them as if they were is a failure in its own right. An output contributes to an outcome: the change in the stakeholder's world that the output was meant to bring about. A paid subsidy is an output; a family no longer needing assistance is the outcome. That gives you two points of measurement, and the discipline is to track both, because a service can hit every output target while the outcome never moves. (This is how Measurement Theatre shows up in an operating model: every service level is green, and nobody is better off.)
There are only three things worth measuring about John's service, and you already know all three from his story.
The first is what it cost to serve him: less than a dollar online, compared with thirty at a counter. That is efficiency.
The second is whether the service kept its promise to him: a decision made quickly, made correctly, and available at the hour he was free. That is quality. Together, efficiency and quality make up the service level, and they answer the Deliver question: are we getting it done well? The useful thing is that these measures repeat. Services of the same type are measured in much the same way, so the pattern gives them to you.
The third is the one that actually mattered to John: did his family get off assistance? That is effectiveness, and it's the only one the pattern can't give you, because it depends on what this particular program was for. A service can be cheap, fast, and accurate, with every light green, and John's family can still be no better off. That's why you track all three. Effectiveness is the measure that points at the Discover question, are we getting the benefits? It is the service's contribution to the outcome, and the first evidence toward that answer. The answer itself is claimed only when the outcome evidence comes back.
Read over a period, the three together are the service's results: how well it produced its output, counted in units. The service controls efficiency and quality. It answers upward, to the executive who owns the outcome, for efficiency and effectiveness, and sideways, to the people it serves, for quality, because quality is the promise it made them.
Target Operating Model (TOM)
A target operating model is the design of an operating model's future state. It's a blueprint of the capabilities and services the strategy requires, usually with a roadmap for building them. The current operating model describes how the organisation runs today; the TOM describes how it intends to run once the strategy has been delivered.
Picture the agency that serves John designing the version of itself that would serve him well. That design is a small set of connected models, not a thick binder:
- A context model: who the operating model serves and works with, including stakeholders, suppliers, and partners.
- A service model: the services it delivers, their outputs, and how they link together into value chains.
- A capability model underneath: the capabilities each service puts to work, and the target maturity for each one. (This is where the capability maturity profile gets set.)
- Clear accountabilities: who owns each service and is responsible for its service level.
The trap is a TOM that is just a new org chart with a date on it. A target operating model worth the name changes the service model first and lets structure follow, instead of redrawing boxes and calling it transformation. It is grounded in explicit design parameters drawn from the strategy, tested against real stakeholder scenarios, and equipped with the measures that will show whether it's working.
Free template: The Service Operating Model Canvas maps any operating model or TOM on a single page: the capabilities, the services that put them to work, their outputs and service levels, and the outcomes they contribute to. Use it to stress-test a redesign before anyone touches the org chart.
The Field, and Why This Approach Cuts Through
Operating models attract a lot of thinking and little agreement. It's worth naming the main camps, because the service-oriented model is defined partly by what it rejects.
| View of the op model | What it gives you | The catch |
|---|---|---|
| The org chart is the operating model | Boxes and reporting lines | Structure is the weakest lever; a reorganisation changes nothing |
| The definitional debate (which concept sits inside which) | Terminology, and endless arguments over who sits where | Agrees on the pieces but never on how to arrange them |
| Conceptual frameworks (Guild, Bridgespan, Campbell) | A design process and a set of domains | Treats the strategy as given; produces a roadmap, not something you can run and measure |
| Transformation hype (digital, "next-generation" operating models) | Energy, urgency, and a bundle of fashionable techniques | Admits its own confusion about what is actually changing; no backbone of measurement |
| The service-oriented model (this approach) | Capabilities become services that produce measured outputs, which contribute to outcomes | Requires honest service definitions and real outcome data, which takes more effort up front than redrawing boxes |
The service-oriented model doesn't just add one more framework to the argument about who sits where. It gives the operating model three things the field keeps missing, and all three are visible in John's case. A backbone: a capability became a service, which produced the subsidy, which got his family off assistance. A measurement layer: cost and quality told the agency the service ran well, and effectiveness told them John was actually better off. And a direction: the whole chain points at a person at the end of it, not at a set of domains to debate. Every element connects to something real and observable, and that is the difference between an operating model you can govern and a diagram you file away.
Two honest concessions keep this from being a caricature. First, the domain frameworks aren't wrong, and Campbell's Operating Model Canvas is a useful check that nothing has been missed. The service-oriented model doesn't throw the domains away; it puts them to work underneath the services. Second, the approach has a cost. A measured service model requires honest definitions of each service and real outcome data, which is harder than redrawing boxes and slower than a reorganisation. The trade-off is deliberate: more work up front, in return for an operating model you can run and correct, rather than one you admire and then file.
The Business Architect Belongs at the Strategy Table
A COO I know was part of the strategy work at a large energy company, alongside one of the world's leading strategy consultancies. When the strategy was finished, he asked the consultants the obvious next question: how would they help him turn it into operations? The answer was simple. "We don't do that. We do strategy."
That answer isn't the failing of one firm. It reflects a common assumption, stated openly in the established literature: that a strategy team defines the strategy and then hands it to the operating-model work as a settled input. In that account, the business architect is at best a supporting member of the strategy team, and at worst someone who simply receives its output. That role is too passive for what the operating model actually is.
If the operating model makes up the last two steps of the strategic cascade, then the design parameters that turn "our strategy is X" into "the operating model must make Y possible" are strategic choices. Setting them is conceptual design work, and that is exactly what business architecture does: it turns strategy into blueprints and roadmaps. So the architect shouldn't be waiting further down the line to receive the parameters.
Look at what John needed: the subsidy quickly, with no obstacles. That isn't a wish. It's a design parameter, the thing that turns "help families back to work" into an operating model someone can actually build. Get that parameter right and the service falls into line behind it. Get it wrong, or let it be written by someone who has never thought about John, and every later decision inherits the mistake. That's why the architect belongs in the room while the parameters are being written, not afterwards once they're fixed. It's a design job, not an analysis job. Leave the architect out of that room and the strategy makes promises the operating model can't keep: commitments made with no honest view of what the machinery can actually deliver.
This is what it means to treat business architecture as a discipline of strategic management rather than after-the-fact documentation. The field often complains that "architecture" sounds like technical paperwork and gets pushed off to IT. That credibility problem disappears once the work is visibly what it really is: a straight line from a strategic choice to John's family no longer needing assistance, described in language a board can act on. The result isn't a better diagram. It's a live, measured service model tied to strategy, with a practitioner in the room where the choices that shape it are made.
The Operating Model Is the Engine
Strategy doesn't fail because people stop trying. It fails because the machinery that would turn a choice into an outcome was never built, or was built for a strategy no one confirmed, or was mistaken for the org chart and rearranged instead of designed. The operating model is that machinery. It's the engine the strategy takes for granted. Of all the things an organisation reaches for when execution stalls, it covers the most ground: the whole of Develop and Deliver, from building capability to delivering value.
Build it as a service model and it becomes something you can actually run: capabilities put to work as services, services producing valued outputs to an agreed standard, and those outputs contributing to outcomes that link back to the organisation's purpose. Build it as a new org chart and you've moved the boxes without changing anything the stakeholder will ever notice. That choice comes up every time a strategy isn't landing, and it marks the difference between being seen to act and actually putting the strategy you already have into practice.
At the other end of the machine is John, who needed the subsidy in time to take the job. Build the service model and he gets it. Redraw the org chart and he's still filling in the same form for a different division, while the new boxes look tidy on the slide and nothing reaches him.
Frequently Asked Questions
What is an operating model?
An operating model is strategy put into practice. It is the set of explicit choices about how an organisation uses its people, processes, technology, information, facilities, and suppliers, so that the way work gets done actually produces the outcomes the strategy promised. It is the machinery that connects a strategic choice to a stakeholder who is better off.
What is an example of an operating model?
A government agency delivering a childcare subsidy is one. The capability is eligibility determination and benefit administration. The service puts that capability to work as a self-service online application. The output is an authorised, paid subsidy, delivered to an agreed service level: timely, accurate, and costing less than a dollar per transaction online. The outcome is a family that no longer needs assistance. The same lens (capability, service, output, outcome) works just as well for an airline's passenger check-in, a bank's lending, a hospital's chronic care, and a polytechnic's enrolment. See the five worked examples above.
What is the difference between an operating model and an org chart?
The org chart is only one part of an operating model: the organisation-and-people domain, and the least strategic one. It shows who reports to whom, not how a request becomes a delivered result. Treating the chart as the operating model, and a reorganisation as the fix, only changes structure, which is the weakest lever for delivering a strategy. A service-oriented operating model is organised around services linked to outcomes, and that is what actually delivers results.
What is a target operating model (TOM)?
A target operating model is the design of an operating model's future state: a blueprint of the capabilities and services the strategy requires, together with a roadmap for building them. A good TOM is a set of connected models (context, services, capabilities, and accountabilities), grounded in design parameters drawn from the strategy and tested against real stakeholder scenarios. It is not a new org chart with a date on it.
What is a service operating model?
A service operating model (also called a service-oriented operating model) organises an operation around the services it delivers, rather than around the boxes on an org chart. Each service puts one or more capabilities to work, produces a valued output to an agreed service level, and contributes to an outcome for a stakeholder. Because each service's output feeds the next, services link together into value chains. That means the model shows how work actually flows, and can be measured from start to finish.
What is the difference between a business model and an operating model?
A business model describes how an organisation creates, delivers, and captures value: who its customers are, what it offers them, and how it earns revenue or is funded. An operating model describes how it actually delivers that value, in detail: the capabilities, services, processes, and resources that turn the offer into day-to-day operations. The business model is the summary. The operating model is the detail that makes it real and testable.
Why do operating-model redesigns fail?
Most fail because they pull the one lever that rarely delivers a strategy: structure. A reorganisation changes the reporting lines and calls it transformation, while the services stakeholders actually experience stay exactly the same. Redesigns succeed when they start from design parameters linked to real strategic choices, focus on the service layer (the how) rather than the org chart, and measure outputs against outcomes, instead of declaring victory once the boxes have been redrawn.
Continue Learning
Pillar pages
- Strategy to Execution: How to Close the Gap: the four points where the chain from purpose to outcomes breaks, and what closes each one
- What Is Business Architecture?: the discipline, the models, and how it connects purpose to delivery
- Business Architecture Framework: The Design4 Approach: the four-phase governance cycle the operating model lives in
- OKRs Are Not a Strategy: the dashboard that assumes the operating-model engine is already built
- Capability Maturity: where target maturity is set for the capabilities an operating model operationalises
Tools and going deeper (cluster)
- The Service Operating Model Canvas: map any operating model or TOM on one page (free template)
- The Reorg Reflex: why structure is the weakest lever, and what to reach for instead
- Services Operationalise Capabilities: the stable what and the evolving how, in full
- How to Measure a Service: efficiency, quality, and effectiveness, and which question each answers
- Outputs Are Not Outcomes: the service side of benefits, and how to avoid Measurement Theatre
- Design Parameters: The Hinge From Strategy to Operations: how a strategic choice becomes something an operating model can be built to satisfy