Every organisation eventually reaches the same moment.
It discovers that it has become exceptionally good at proving that work happened, and has remarkably little evidence that the work made any difference.
The reports are impeccable. The service levels are green. Activities, outputs, milestones and budgets all reconcile. Then somebody asks the only question that really matters.
Is any of this actually improving the lives of the people we're here to serve?
Somewhere in the data behind those reports is a woman named Jane. She was referred in March, seen four times by June, and closed as a completed case in July. Every part of that record is accurate. Whether her life is different, nobody knows, because no one was ever asked to find out.
Organisations exist to make someone's situation better. Almost everything they measure is about themselves.
Jane's file isn't an outlier. It's the default case, and it used to be excusable.
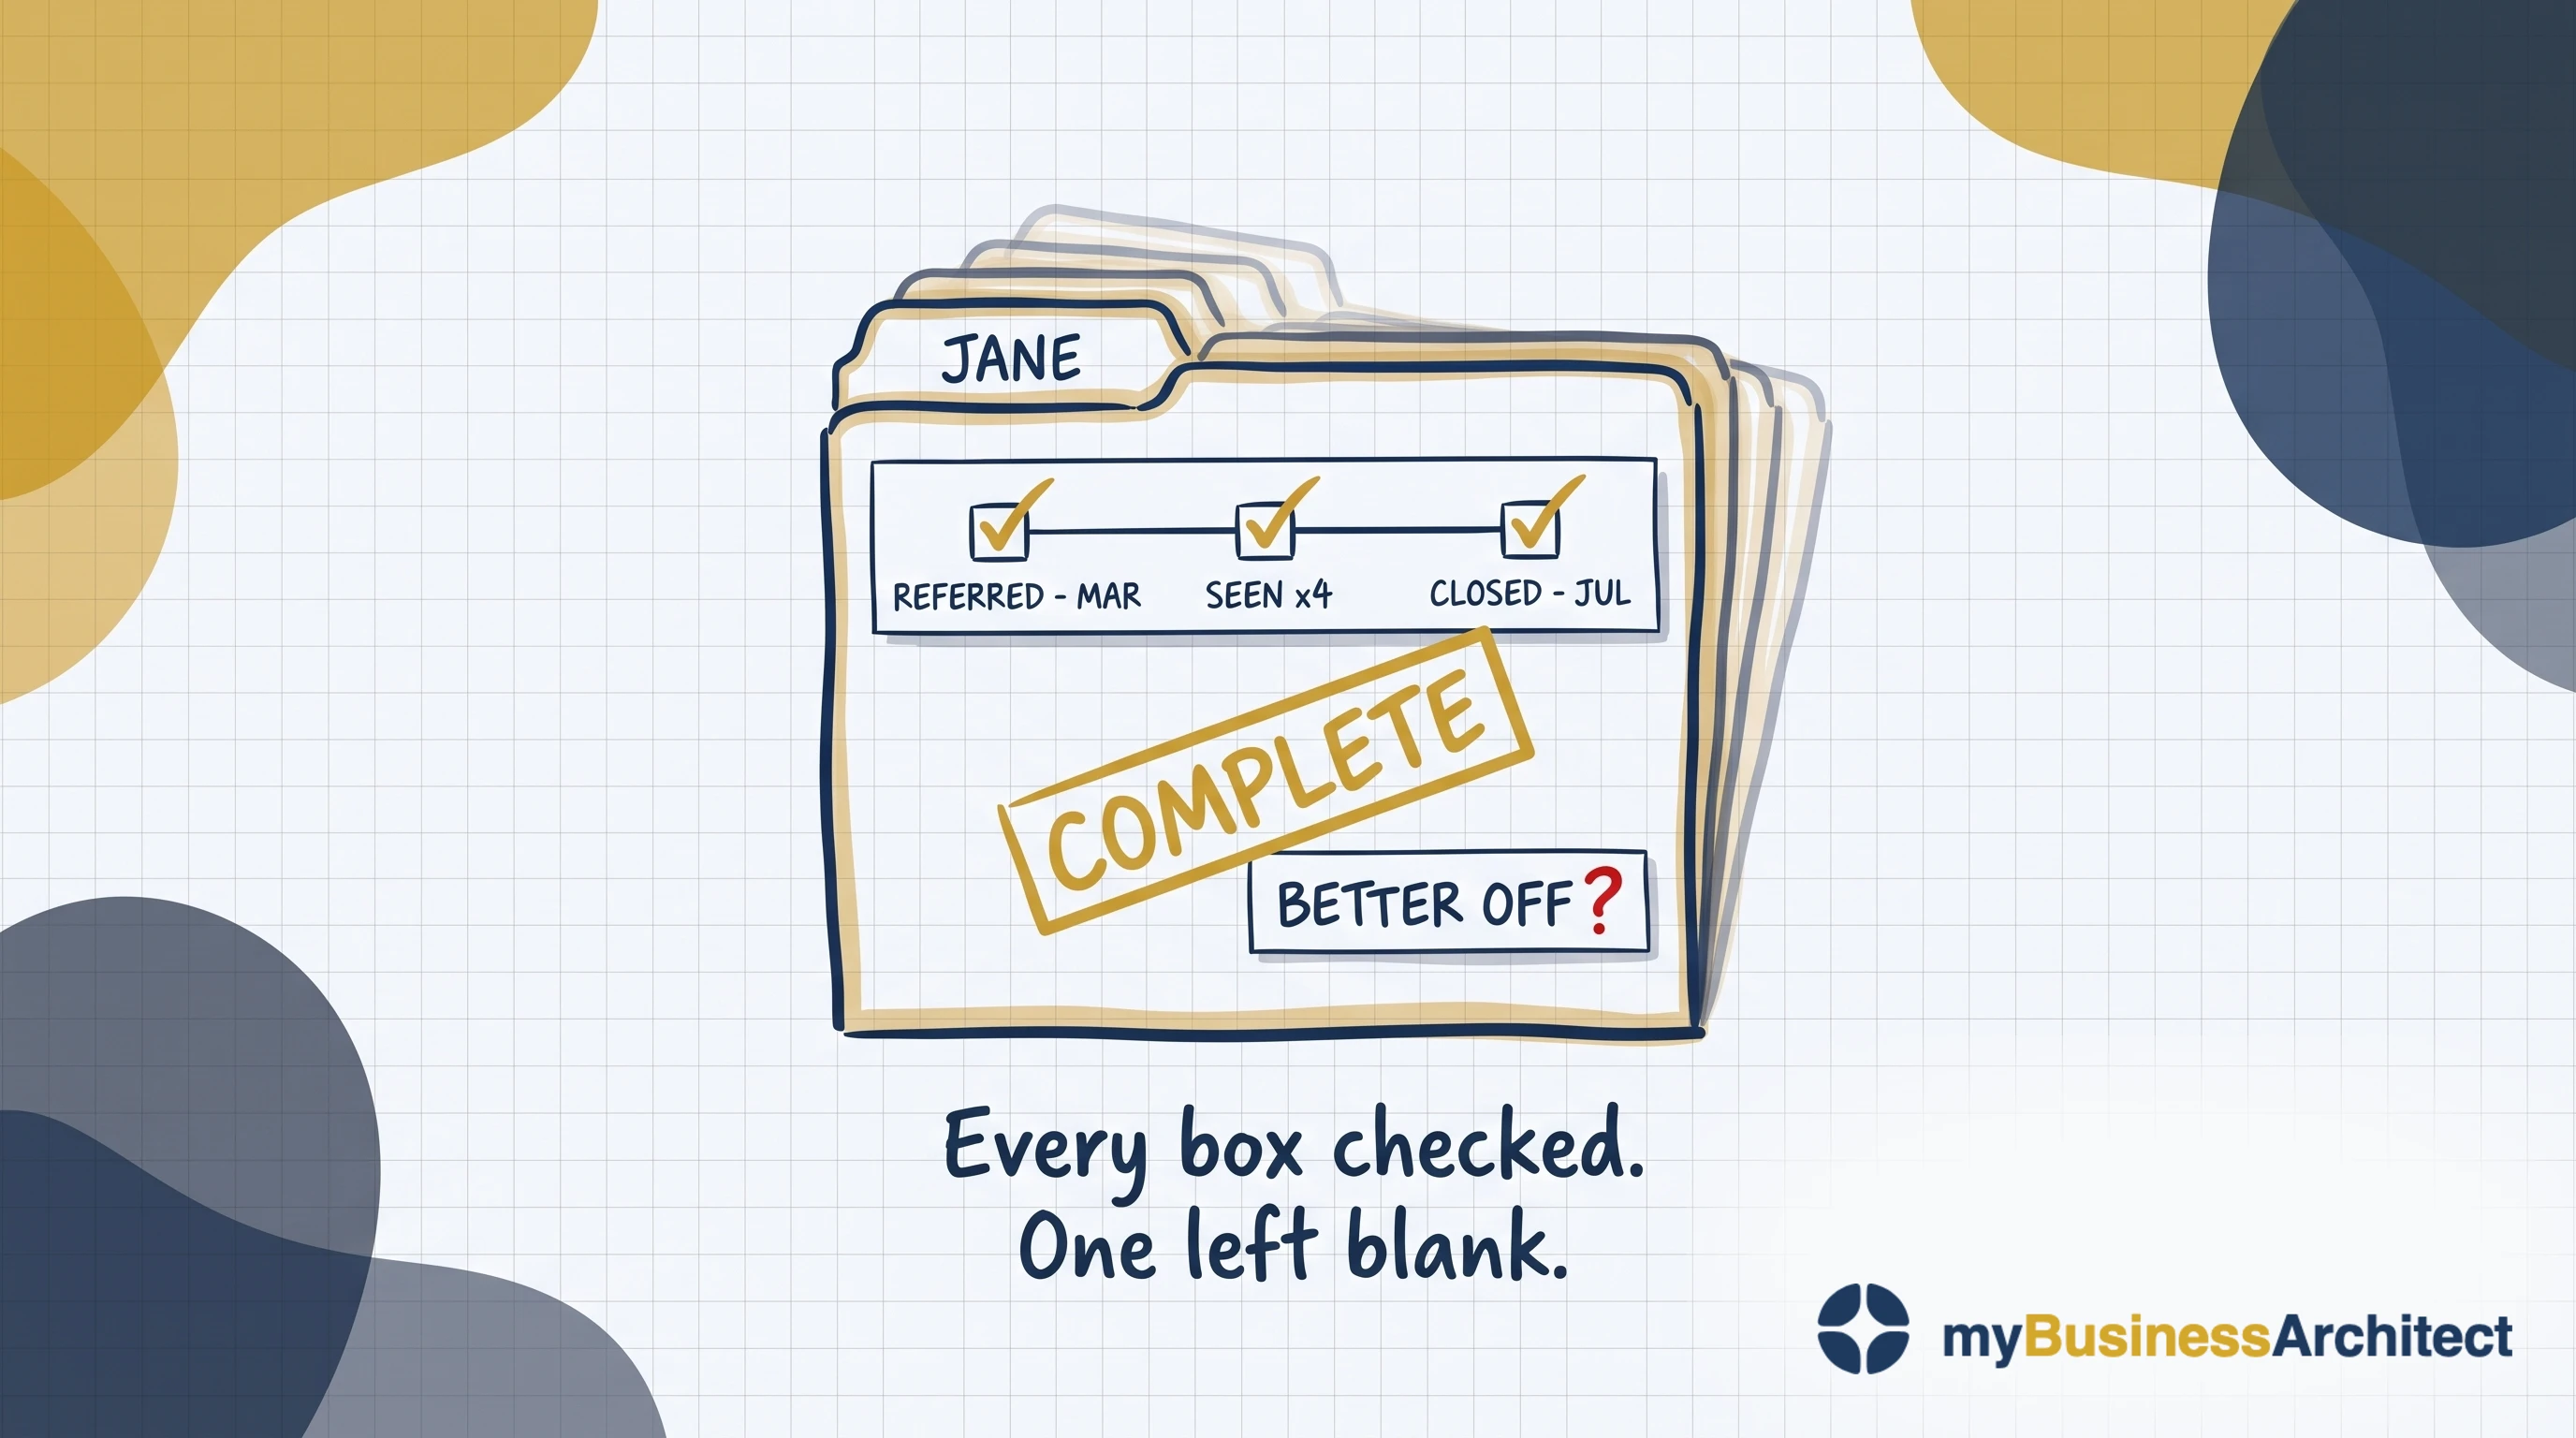
That question used to be the soft half of the conversation, asked at the end and answered with an anecdote. It isn't any more. Purpose has stopped being a branding exercise and become a performance driver: staff choose employers by it, funders and regulators want evidence of it, and the people you serve measure you against the best experience anyone has ever given them. Three forces make strategy fail, and purpose is the least understood.
Which puts the weight on a single connection that almost nobody maintains. Operations generate the evidence. Purpose is what the evidence was supposed to be about. When the dashboards are green and the people you exist for are no better off, that connection is where the break is.
Four questions can help pinpoint where it occurs. Whether strategic choices flow from purpose: are we doing the right things? Whether capabilities are designed to execute the strategy: are we doing them the right way? Whether operations reliably deliver on those capabilities: are we getting them done well? And whether any of it reaches the people it was for: are we getting the benefits?
Those are John Thorp's Four Ares, and the fourth tests the Operations-Purpose Gap. The first three look forward; only the fourth cycles back from operational results, how well the services produced their outputs in the period, to purpose. That makes it the only one that can show when everything has drifted.
It is also the only question with no owner, no method and no budget. The other three have professions attached to them: strategy, architecture, delivery. This one gets a quarterly report.
So the reporting keeps improving and the question keeps going unanswered, because a system built to count what it produces will get better at counting, indefinitely, without ever being able to tell you whether it mattered.
Practitioners in health and human services will recognise this question. It's Mark Friedman's, and it comes third in a sequence of three:
How much did we do?
How well did we do it?
Is anyone better off?
Almost every management system ever built answers the first two of these questions and stops. Not from any gap in rigour or intent, but because measurement built for judgment flows in one direction, upward, and stops. That isn't a defect in its design. That is its design.
The first two questions are about the organisation, which can watch itself. The third is about someone else's life, which it can't.
What is a performance measurement framework?
A performance measurement framework is the structure that defines what an organisation measures, why each measure exists, and how the results are used. It specifies the indicators, the evidence behind them, who owns each one, and the decisions they inform. A framework differs from a scorecard: a scorecard arranges measures, a framework connects them to purpose.
That connection is where most performance measurement frameworks fail. Almost every one in use is complete on its own terms, with domains, indicators, targets, owners, a reporting calendar and a governance forum. What it lacks is any statement of what each measure is evidence for. Without that it can tell you a number moved, but nothing about whether the movement mattered.
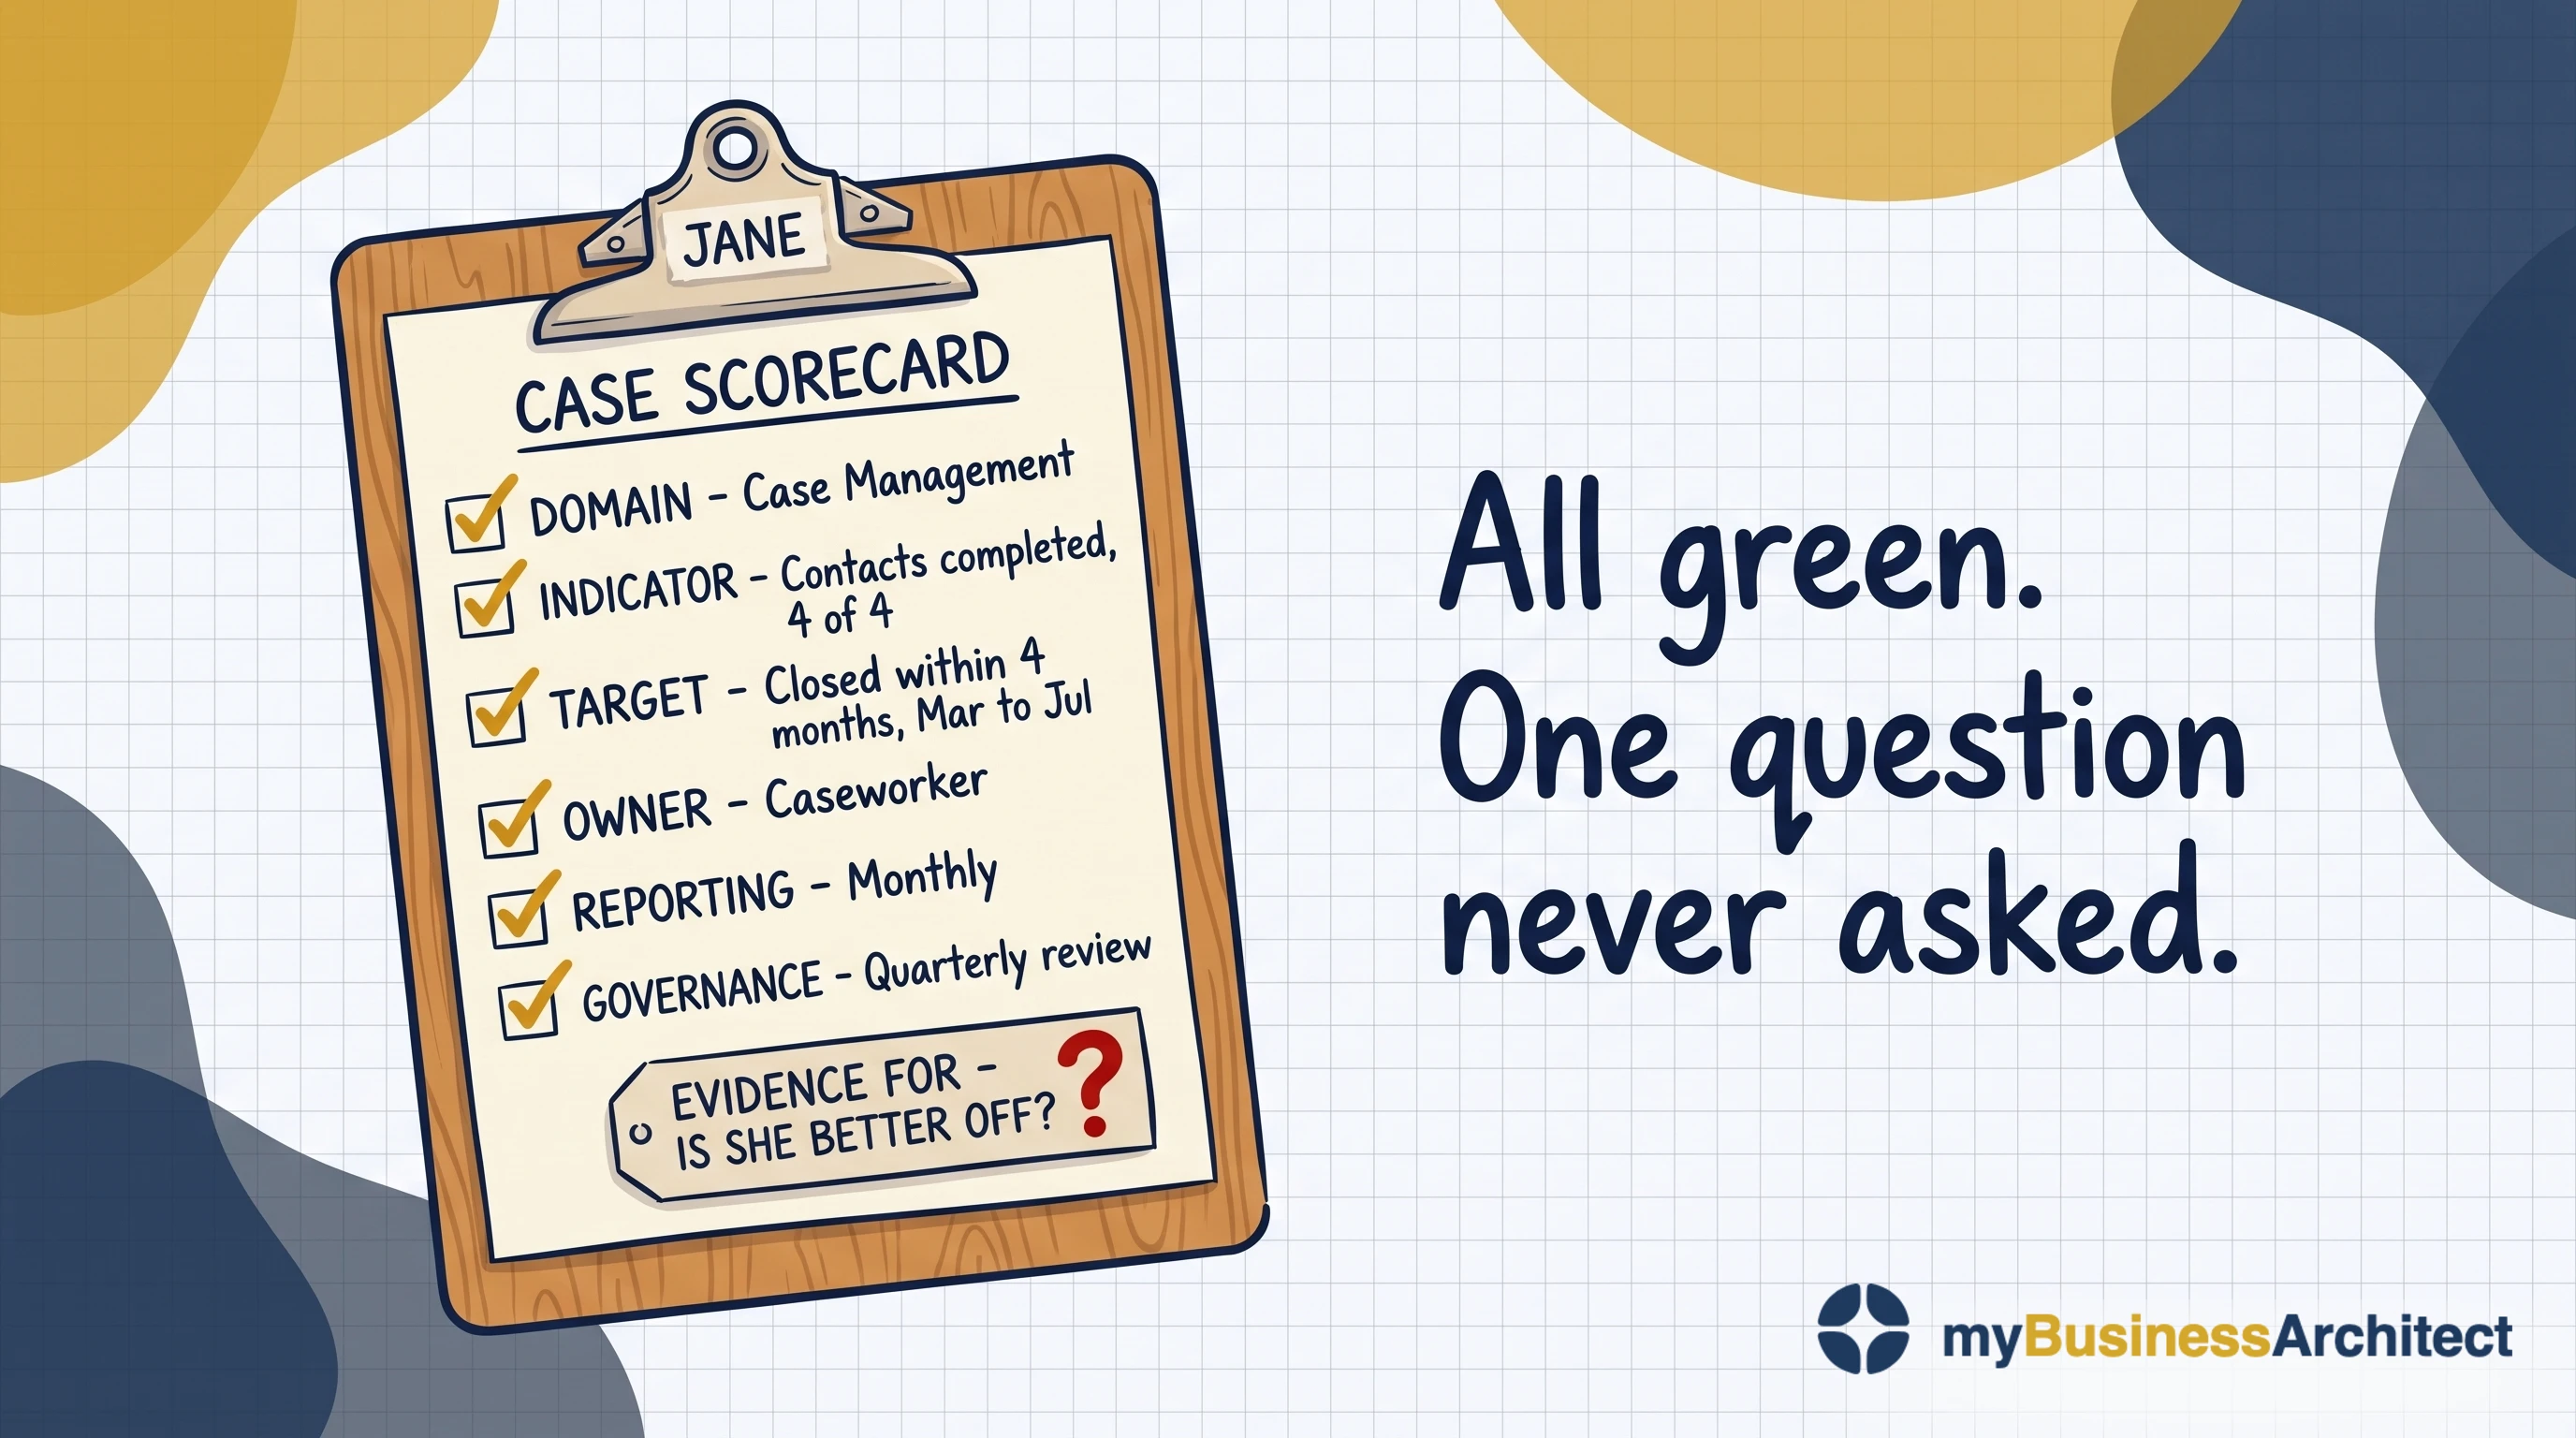
The best known incumbent is the Balanced Scorecard (BSC), and it earned that status. Before it, a case for investing in staff capability or customer experience had to be turned into a financial figure to get attention. The BSC gave those arguments standing of their own.
What it doesn't do is connect its perspectives. It has no test of whether one causes another. The strategy map is meant to supply that, but its arrows are drawn once during implementation and never tested. They show proximity, not causation.
None of this is about a program. Programs end, and their measures end with them, the bounded case benefits realization already covers. This is about the operating model services you'll be running every day for years to come.
The Ten-Minute Diagnostic
Five questions, answerable in a leadership meeting without preparation.
- Name one decision that changed last year because of something a measure told you. Not a target adjustment. A decision: something started, stopped, funded or refused.
- For your top three indicators, what causal claim is each one evidence for? Not what it tracks. What moving it would prove.
- Is there a measure your leadership team hasn't been able to agree for more than two quarters? Name it.
- When your last major program closed, what happened to its benefit measures?
- Who owns the question "are the people we serve better off?" Name a person, not a committee.
Fail three or more and the cycle is running as a line rather than a loop. That isn't a resourcing problem and more indicators won't fix it. Start with the forum below, not the dashboard.
Take the full diagnostic: Find Your Gap: 4-minute assessment →
The cheapest outcome data is a question
There's an obvious way to find out whether anyone is better off, and most frameworks avoid it. Simply ask them.
Only the people who were supposed to be made better off can say whether they were. No other measure can.
Ask the people you serve for feedback, do it systematically and repeatedly, and treat what they tell you as performance data rather than customer service. That answers the question by asking the only people it's really about.
One distinction decides whether this reaches outcome or simply stops at experience. Ask about their life, not about you.
A satisfaction survey asks whether the service was good. A perception-of-care instrument asks whether staff listened, whether the referral came when needed, whether the building was clean. Those are experience measures, worth having, but none of them tells you whether anything changed. They answer how well you did it, the second of Friedman's questions, not the third. The question that gets at outcome is closer to: is anything different for you now, and what?
Most organisations already run surveys of this kind and reasonably conclude they have this covered: the channel, the consent, the contact details, the habit are all solved. What's missing is that every question points back at the organisation rather than at the person answering. A few questions, asked a few weeks after the last contact, will give most of the decision value of a formal evaluation, at a fraction of the cost.
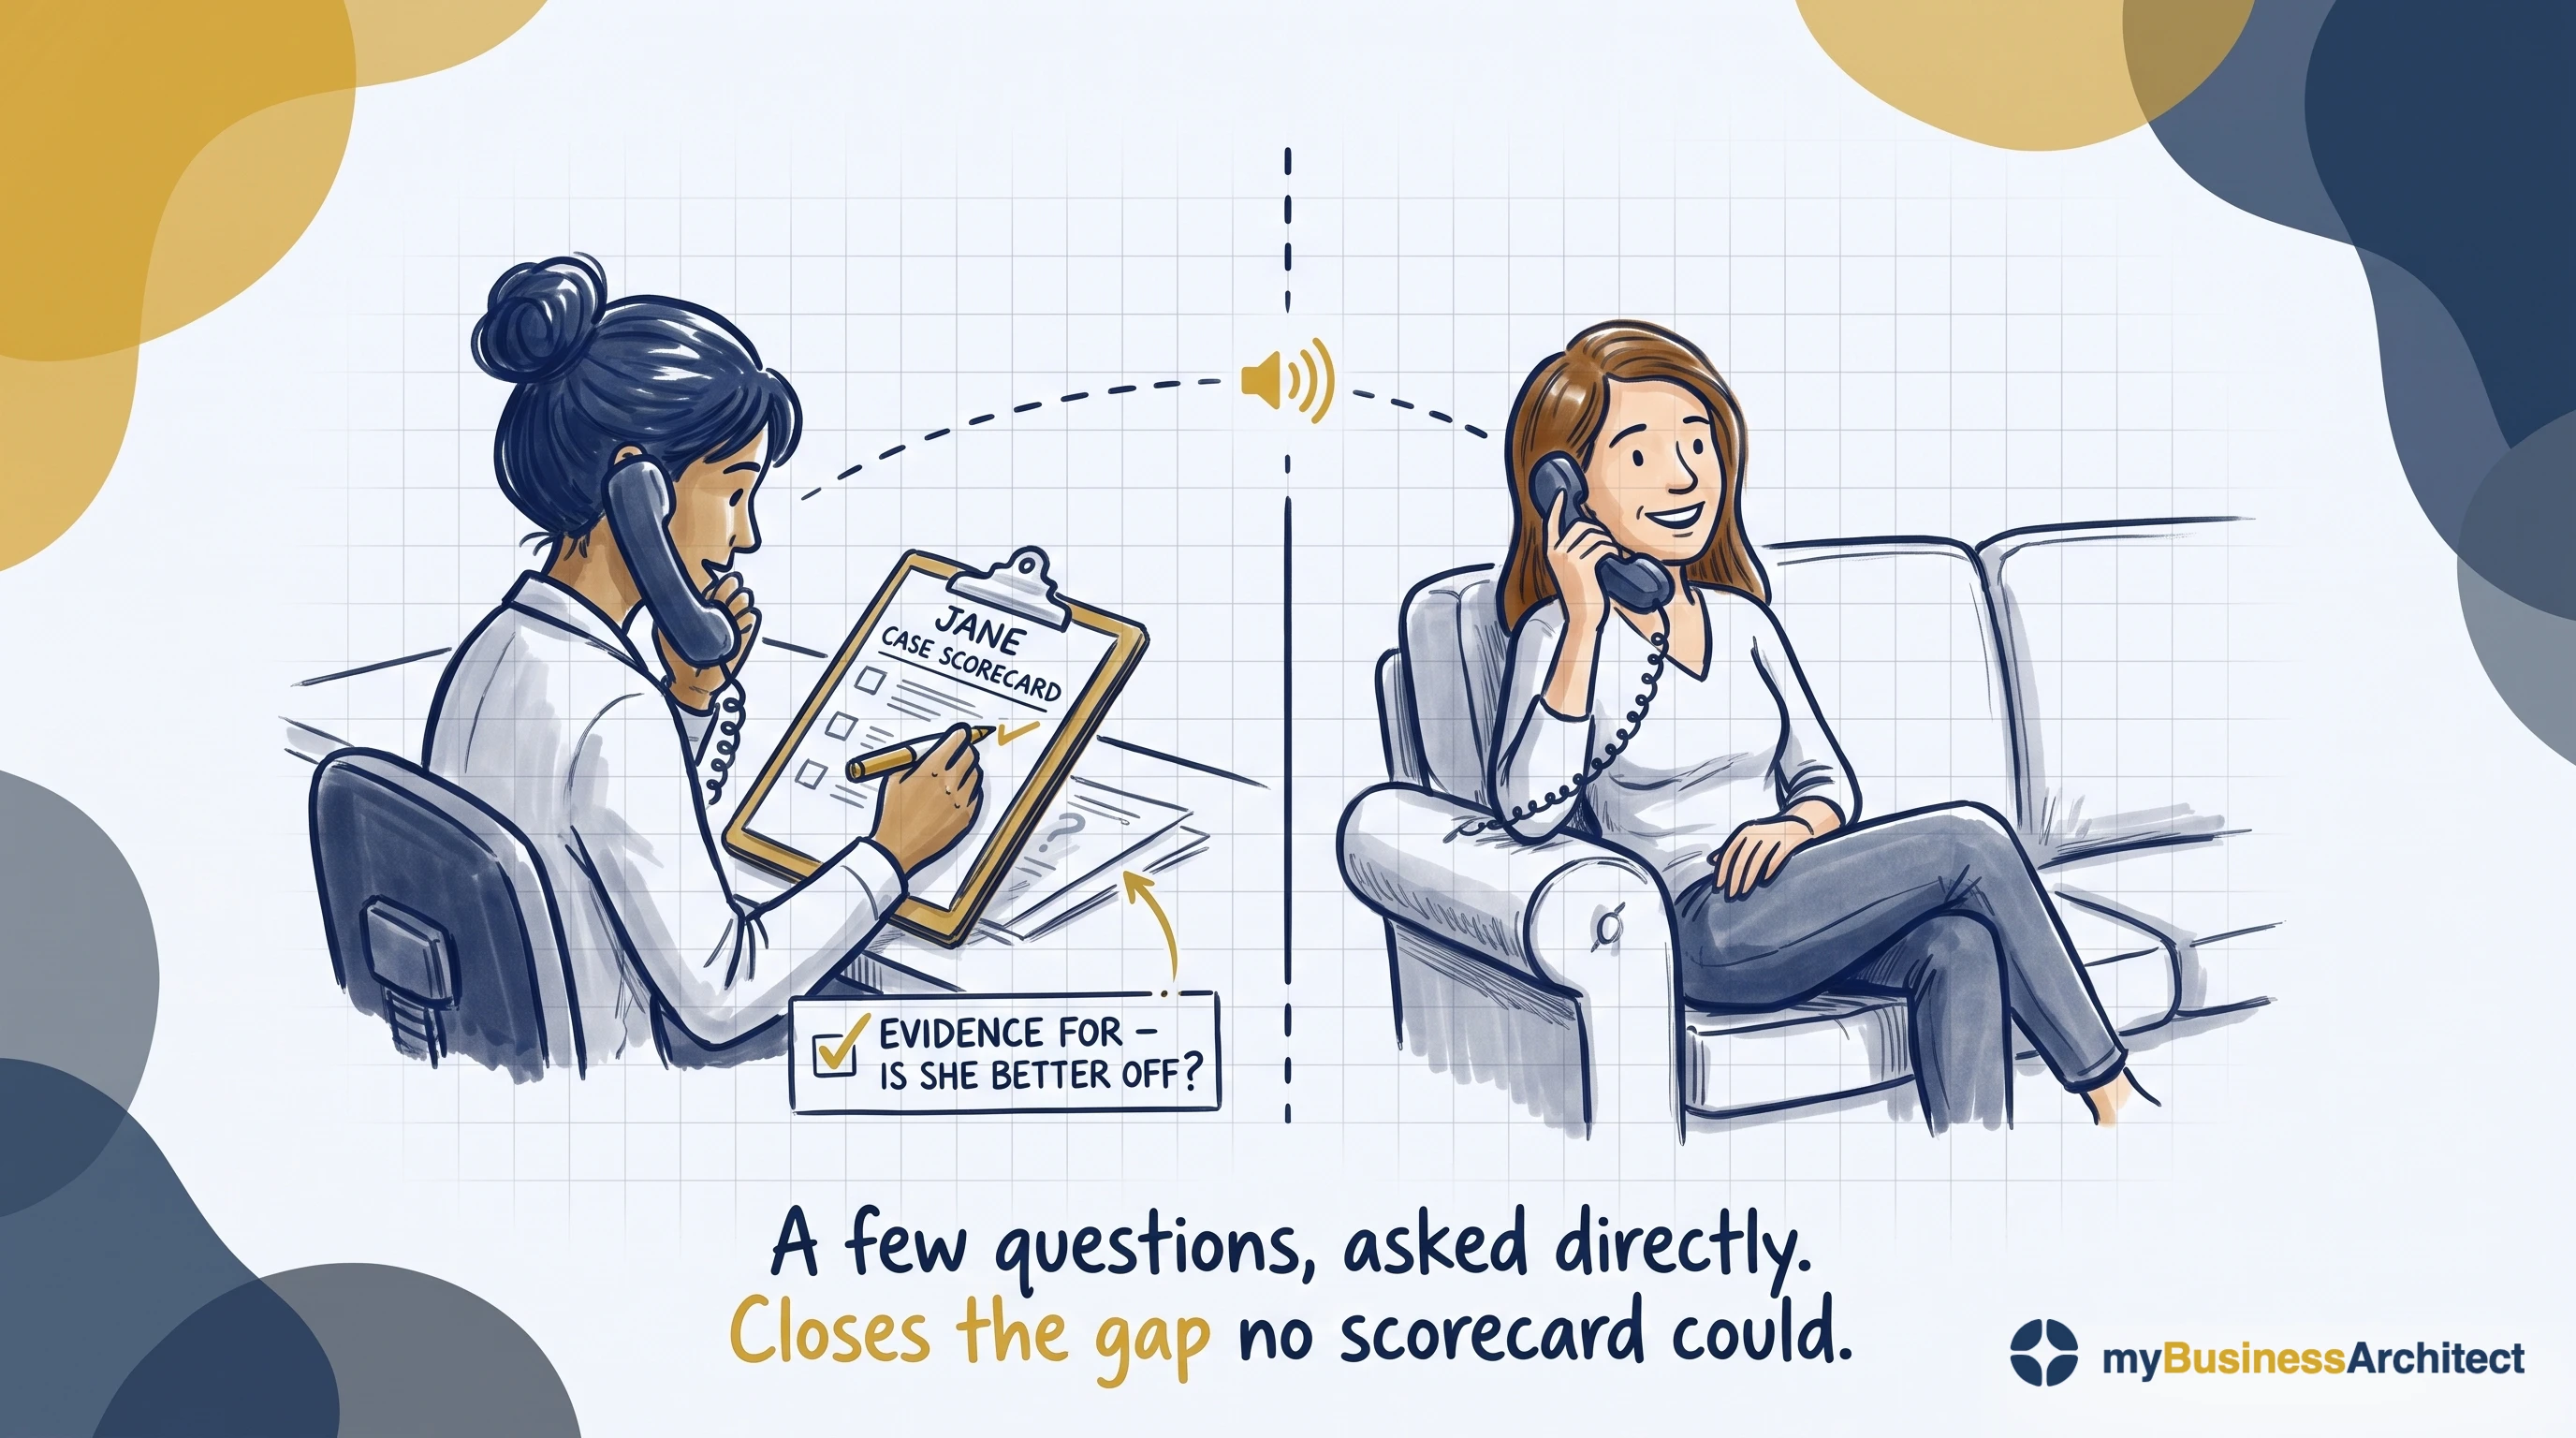
The channel is a design decision, not an implementation detail. Text and email systematically miss people without a phone, a fixed address, or settled circumstances, and in homelessness, mental health, and crisis services those are often the people whose outcomes matter most. A channel that excludes them doesn't produce a smaller sample. It can inadvertently produce a biased one.
The evidence that feedback improves outcomes is suggestive rather than conclusive. But it's cheap, it's fast, and it's the only measurement that asks the people the service was for.
An organisation can spend six figures on outcome infrastructure and still never ask Jane a single question. That's a choice, even if nobody noticed making it.
Whether the work got done is not whether anyone is better off
Two hundred and forty people attended. Ninety-four per cent of appointments offered within target. Caseload down eighteen per cent.
All true, all useful, and all about the organisation rather than the people it exists for.
Most people know the difference between outputs and outcomes. What gets said less often is why knowing it never seems to help. Outputs happen inside your systems, on your calendar, within your control. Outcomes happen in someone's life, over years, tangled up with everything else happening to them. One is cheap to observe; the other is slow, expensive, and arguable. So measurement drifts to the cheap end, and the framework fills up with things that are true and beside the point.
The three faces: improvement, accountability, research
Measurement serves three purposes, and they don't mix. Improvement needs data that's granular, fast and safe to be wrong. Accountability needs it aggregated, defensible and comparable. Research needs something else again. Leif Solberg named the three in 1997 and warned that combining them was counterproductive, and the same conclusion has since been reached independently in health improvement and in higher education.
Accountability is the face that dominates. Answering to someone is legitimate and usually necessary: boards and funders are entitled to know. But accountability becomes judgment the moment a consequence attaches to the answer: money, a ranking, a contract, a career. And that is very often the case.
The two rarely look alike.
| Judgment | Improvement | |
|---|---|---|
| Owned by | The board or the funder | The people doing the work |
| Data | Aggregated | Granular enough to act on |
| Posture | Defended, not explored | Expected to be wrong sometimes |
| Horizon | Finished once reported | Aimed at what happens next week |
| Return leg | None needed | Improvement depends on having one |
Most organisations run one system and ask it to do both. Accountability always wins, because it has a deadline and an audience. And the moment it wins, learning stops.
Accountability also runs in four directions, a distinction owed to Alnoor Ebrahim: upward to funders, regulators and boards; downward to the people served; lateral to peers; inward to mission and staff. Upward crowds out the other three for a reason that's hard to argue with. It's the only direction with money behind it.
For a service the split is concrete. The service controls its efficiency and quality. It is accountable upward, to the executive who owns the outcome, for efficiency and effectiveness, because that executive funds the service and exists for the outcome. It is accountable downward, to the people it serves, for quality, because quality is the output compared with what was promised to them. Effectiveness is the one measure that leaves the operation for external review.
That explains the return leg's problem. It runs downward and inward, the two directions nobody funds, against a system built to serve the one that pays.
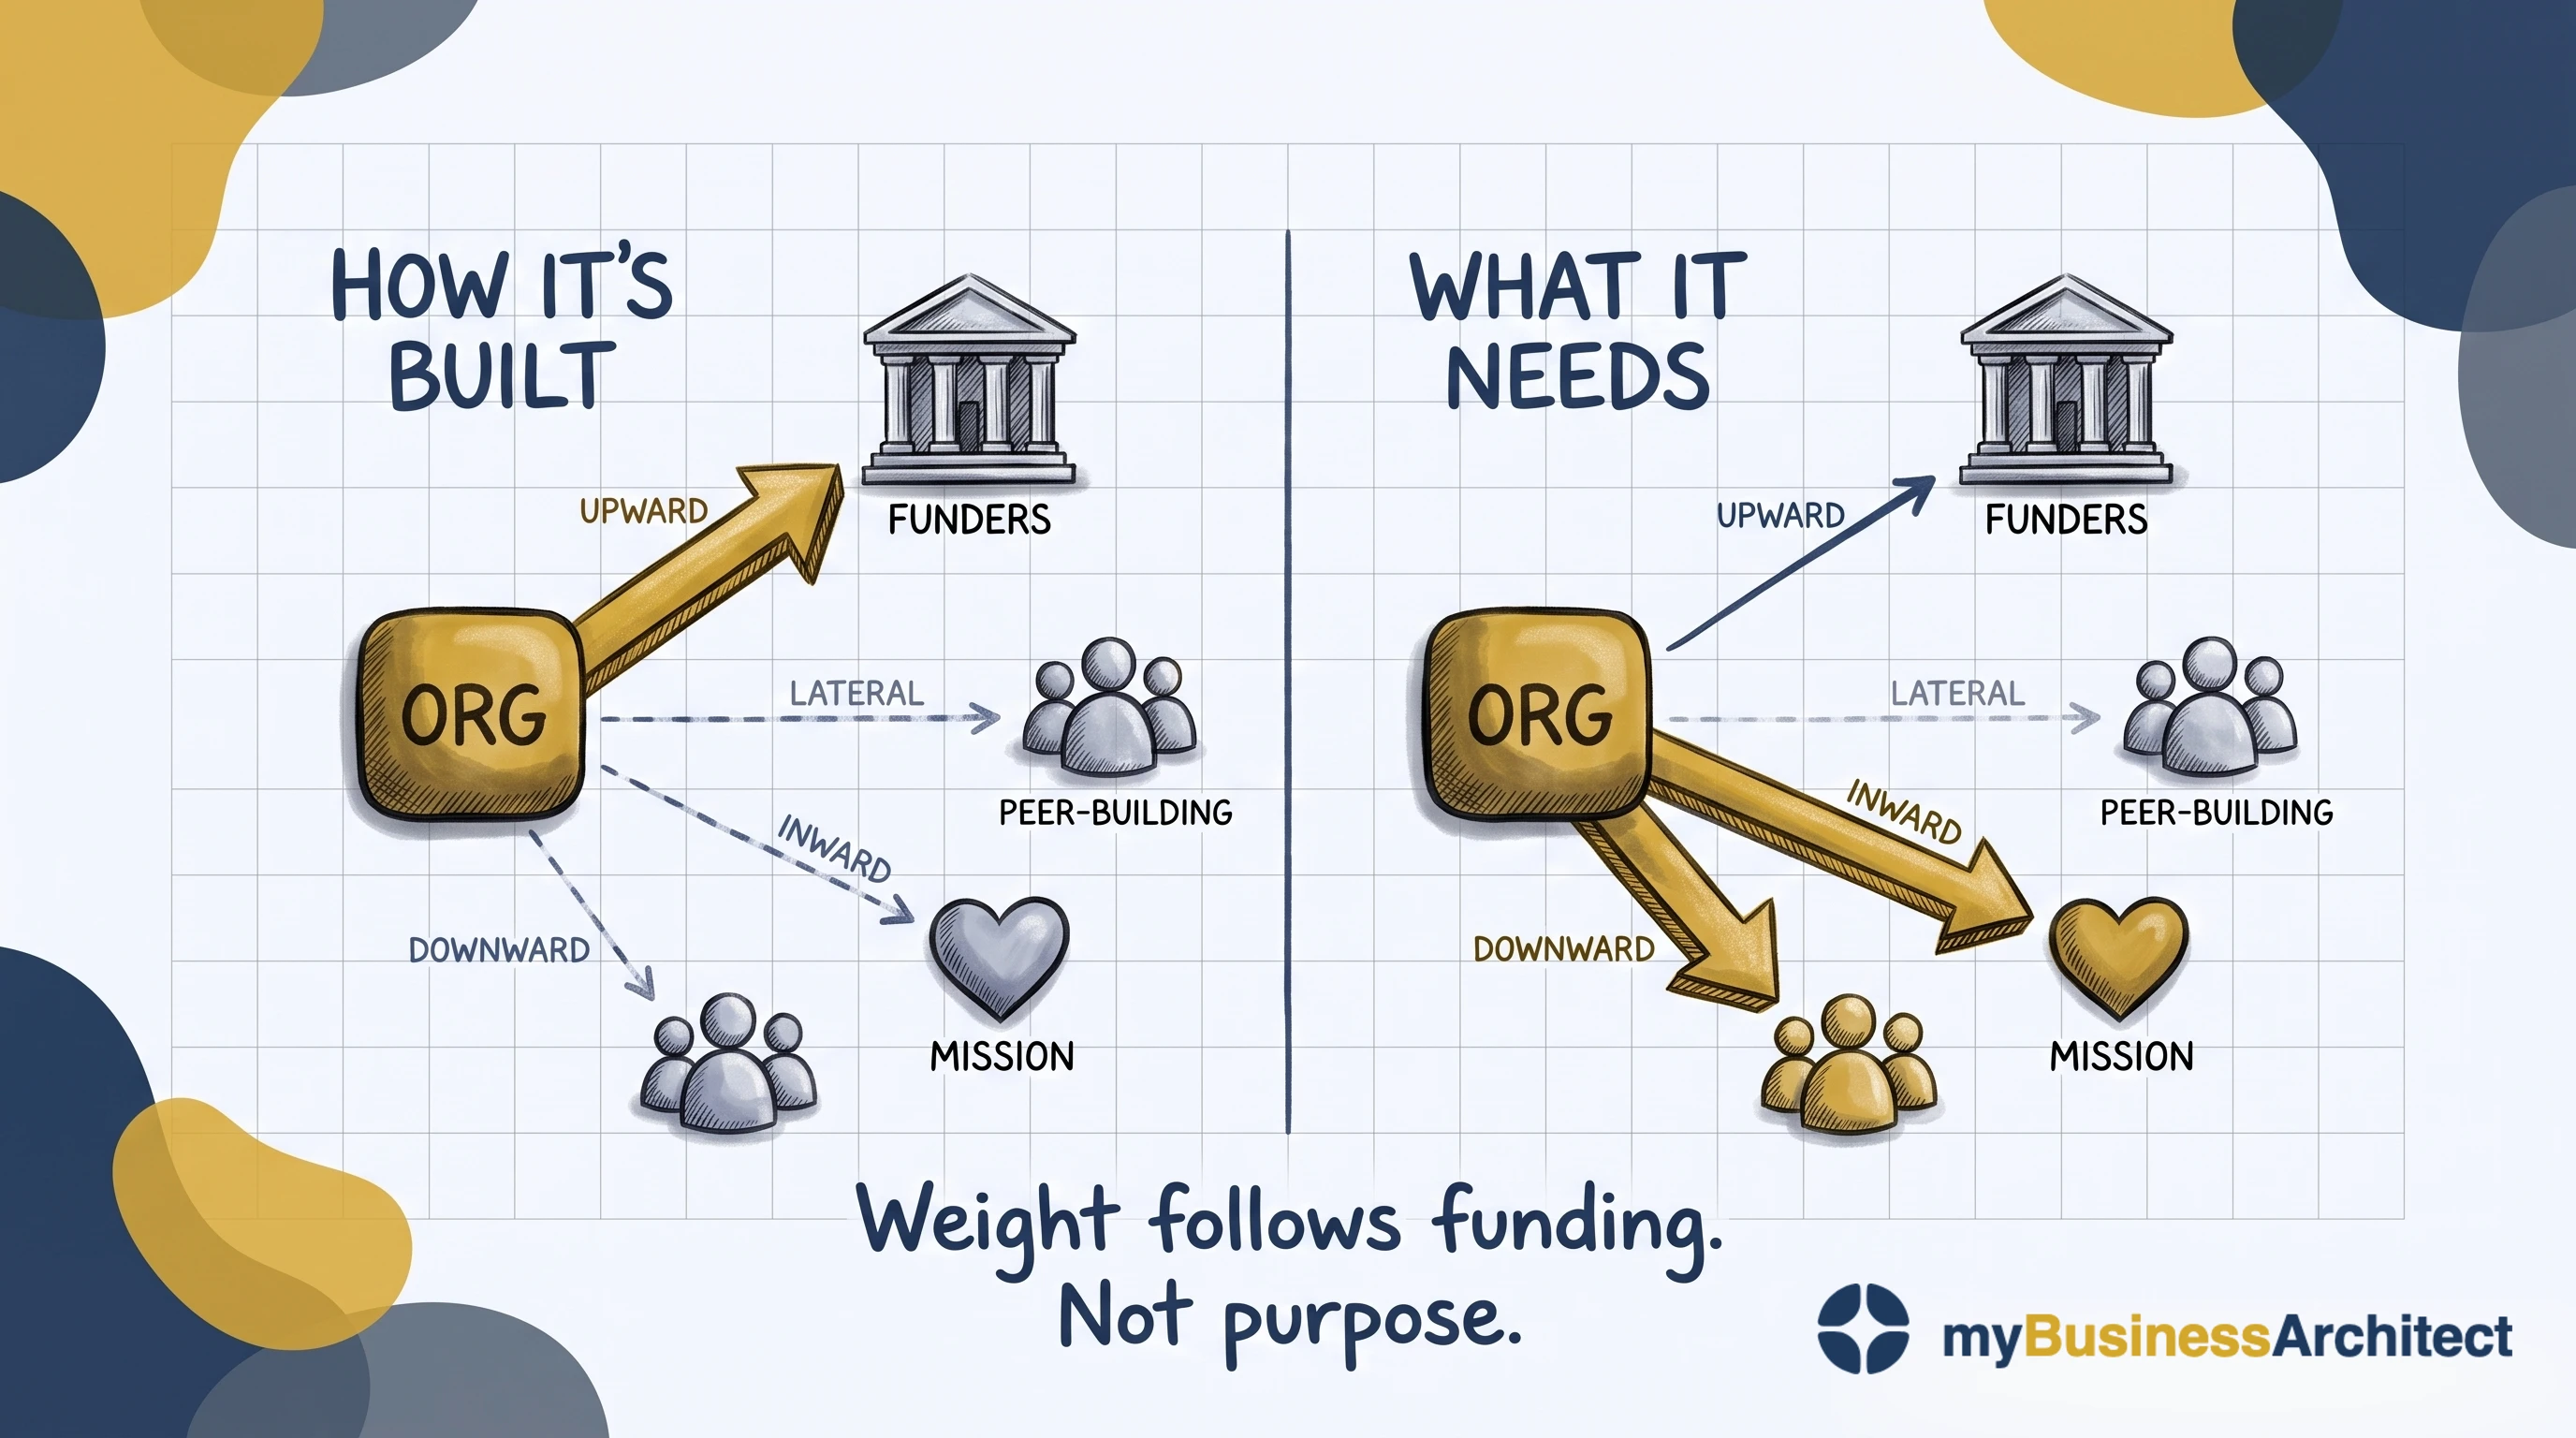
Weight follows funding. The asymmetry in the first panel is not a design flaw anyone chose; it is what happens when only one of the four directions pays for itself.
Before adopting any measure, ask what it's for: improvement, accountability, or research. Then resist the pull to let one system do all three.
Five rungs, five owners
Five rungs, listed from the ground up. The sector's name for them is the impact ladder. Each rung answers a different question, needs a different kind of evidence, and is harder to reach than the one below it.
| RUNG | Question it answers | Evidence it needs | Who should own it |
|---|---|---|---|
| Impact | How much of that change was ours? | Counterfactual reasoning, contribution analysis | Director of Evaluation, outside the reporting line |
| Outcomes | What changed for the people served? | Baselines, follow-up, comparison where possible | Chief Program Officer |
| Outputs | What did we produce? | Completions, availability, quality of the thing delivered | Service managers |
| Activities | What did we do? | Volumes, throughput, coverage | Service managers |
| Inputs | What did we commit? | Budget, staffing, capacity | Finance and operations |
Most performance frameworks are crowded on the bottom two rungs and empty at the top, which is backwards for something that claims to measure performance rather than activity.
So how far up should you climb? Conventional wisdom says as high as possible. Ebrahim and Rangan devoted a well-known article to arguing that this is wrong, and the argument holds.
It isn't feasible, or even desirable, for every organisation to hold metrics at every level of the ladder, and measurement that reaches higher than what an organisation actually does is a distraction from its operational work. Activities and outputs sit largely within your control, so measure those always. Measuring anything above them is a decision, not an obligation.
Ebrahim's later work implies a test: how much control do you have over the outcome, and how well established is the causal link? Strong on both, climb to it. Weak on both, stop lower, measure learning and influence, and claim contribution rather than attribution. Mixed, and the judgment is yours, but the weaker of the two should set the limit.
The common failure isn't measuring too low. It's climbing one rung too high, finding a number there, and then having to defend it. An organisation that controls its outputs and reports impact hasn't been ambitious. It has produced fiction, and everyone knows it. The exposure is double: you risk permanent failure against a standard you were never positioned to meet, and you can be held to account for impacts that were never yours to deliver.
Every indicator carries a causal claim. Not a definition, not a data source. A claim: we believe this moves because that changed, for these people, by this mechanism. An indicator without one is a number in search of a story.
Almost every framework has leading indicators of activity and none of outcome. Referrals, waiting times and throughput all warn you the machine is slowing. Nothing warns you the outcome is drifting, so the drift only appears in the annual lagging measure, long after you could have acted on it.
A few leading indicators of outcome exist and cost almost nothing to collect: early disengagement, and a missed second contact, both show up months before an annual outcome measure would. One leading indicator of outcome is free on top of that, and almost nobody collects it. When the people doing the work stop finding it interesting, learning has already stopped and performance will follow. Enjoyment, learning and performance are coupled and they fail in that order, so curiosity is the first thing to go and the outcome measure is the last to know.
The causal chain, and the measure nobody can agree on
The impact ladder tells you how high to measure. It says nothing about what causes what. That takes a separate structure: the causal chain.
A causal chain is the same five rungs with the links between them stated: this activity produces that output, which enables this outcome, for these people, by this mechanism. In the nonprofit and public sectors the artefact is usually called a logic model or a theory of change, and it's often a condition of funding. It isn't a value chain or a process map. Those describe how work flows. A causal chain asserts what causes what, which is a claim that can be wrong.
Most organisations have a logic model. Very few have one that gets used.
The characteristic failure is neat horizontal tiers with no arrows between them. Outcomes on one row, activities on another, adjacency implying a relationship nobody has asserted. Nothing states which activity produces which outcome, so no link can be tested and no assumption is written down.
Tiers are the easy part, and most organisations have done them. The arrows are what make it a causal model, and almost nobody draws them, because an arrow is a claim you can be held to.
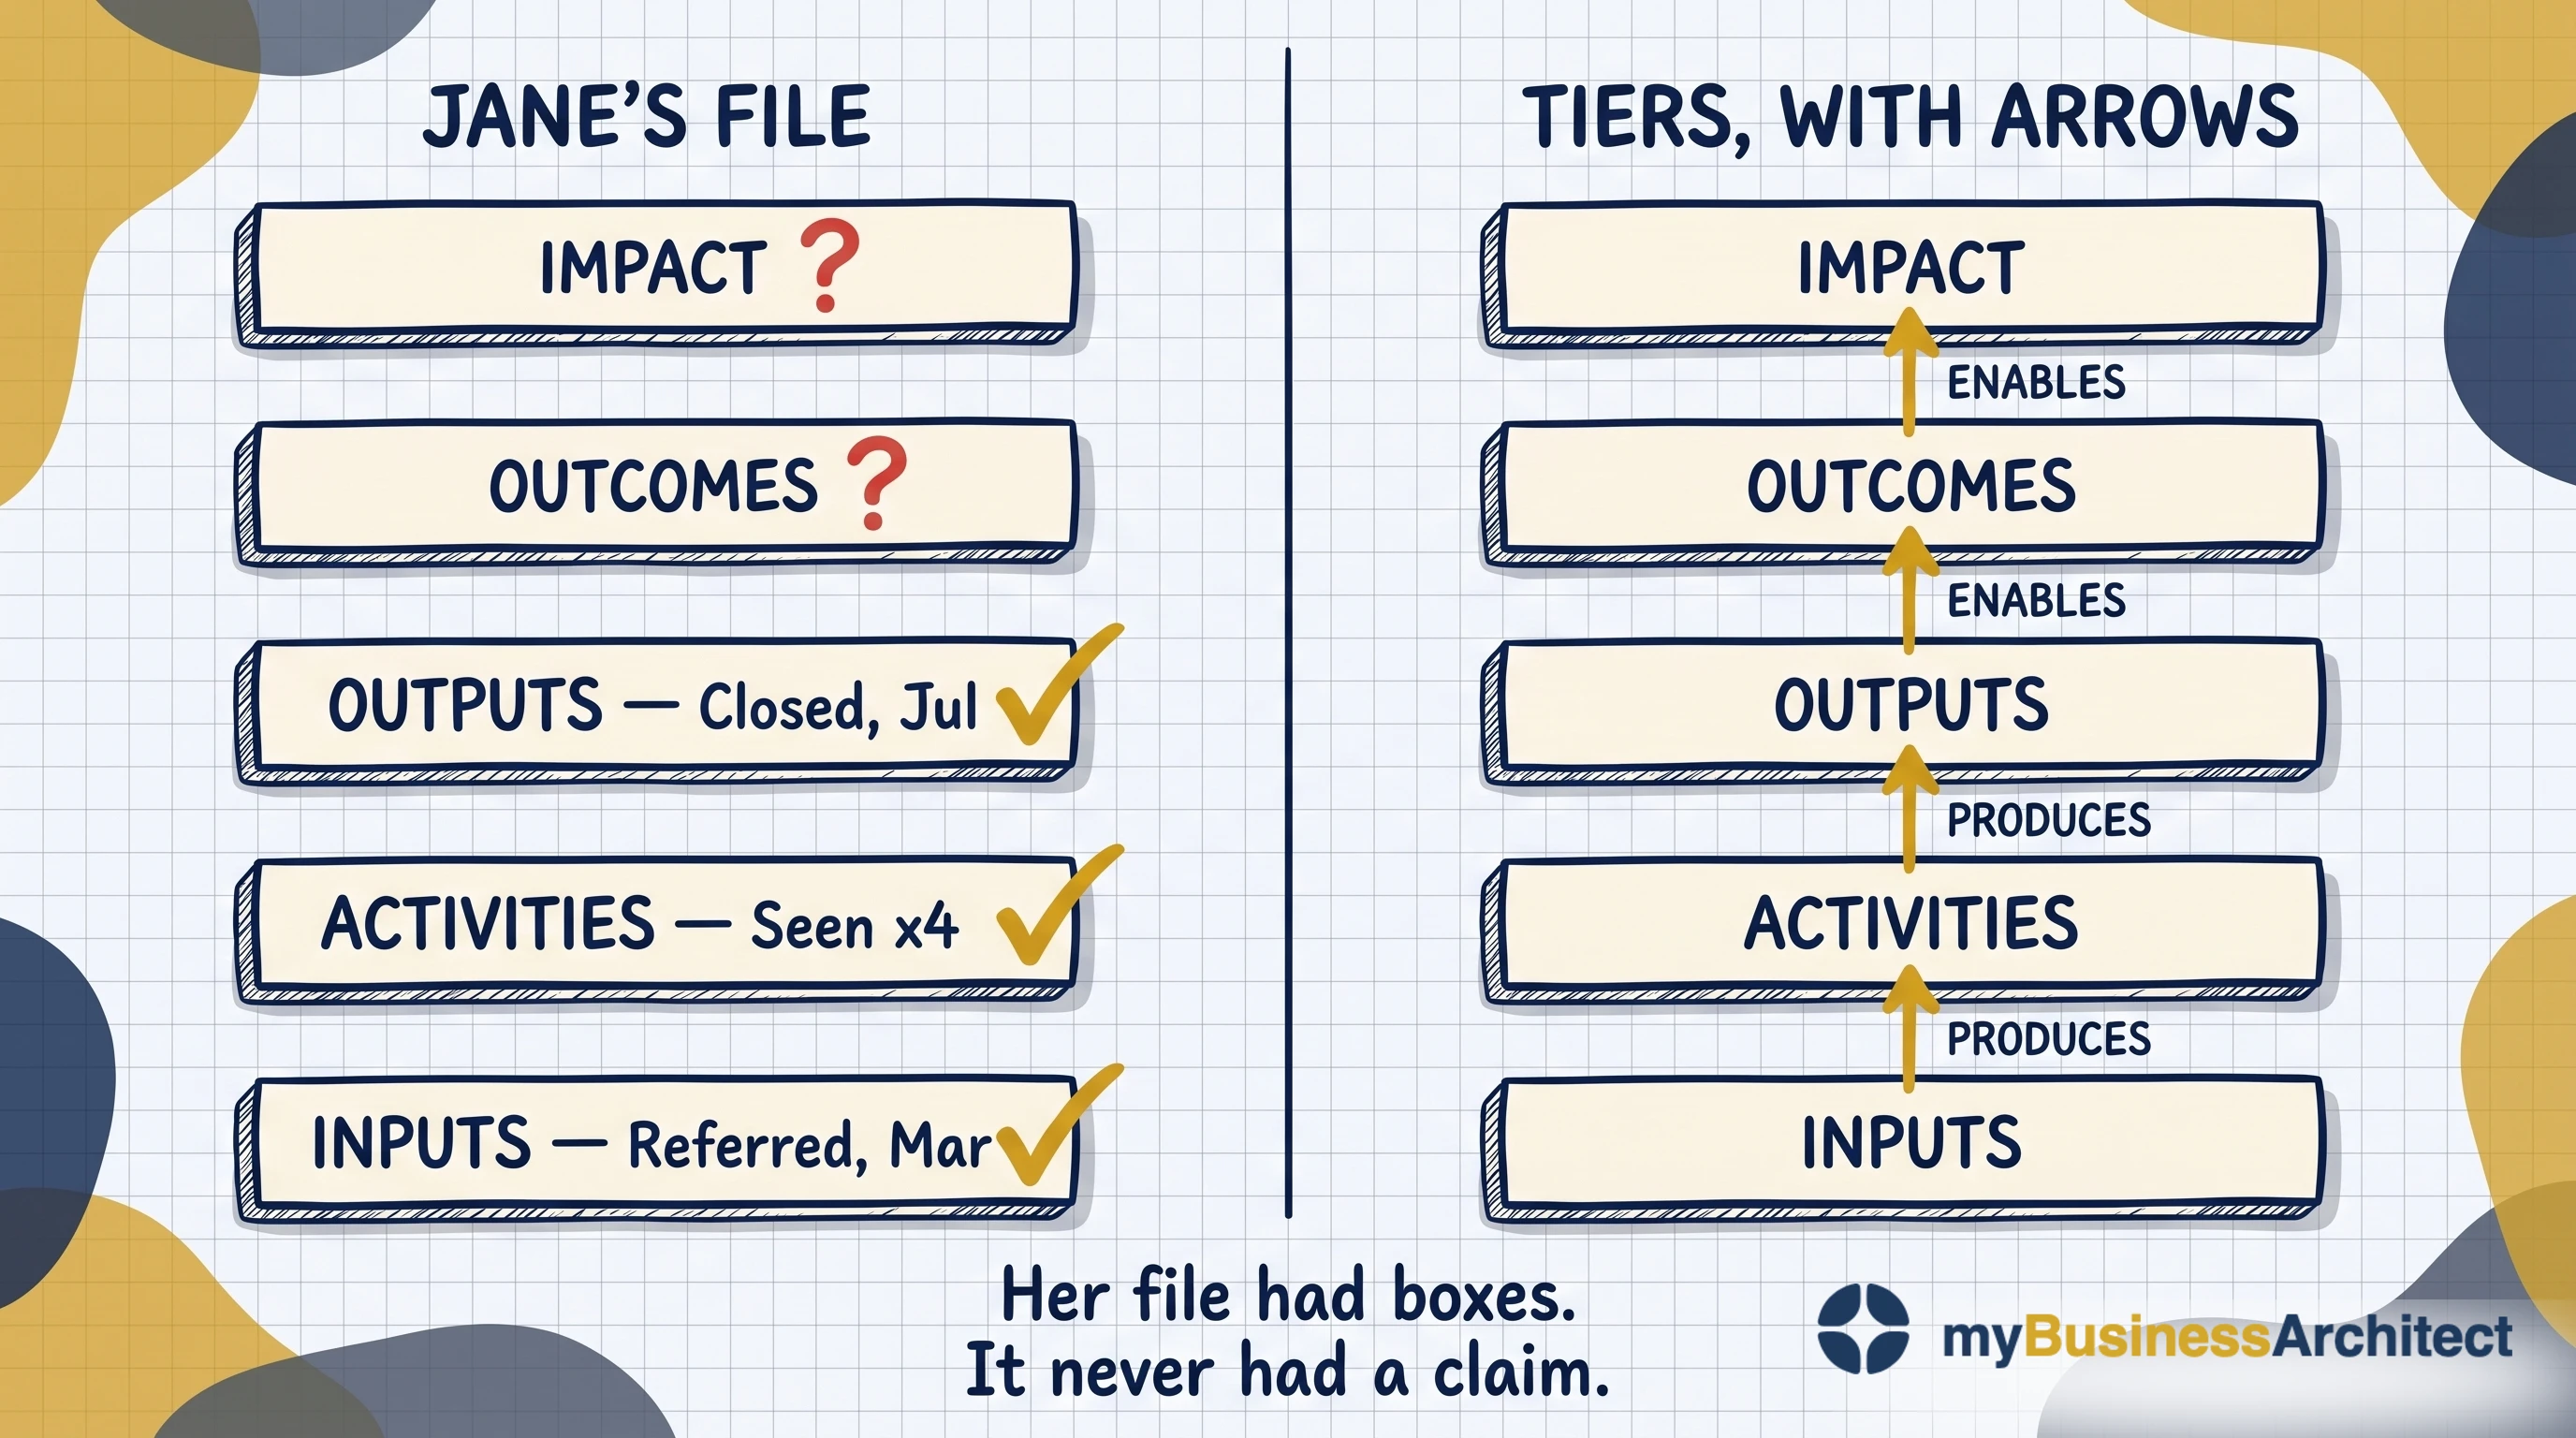
Drawing them sounds like an invention exercise. It usually isn't.
The reasoning is nearly always written down already, just in the wrong place. It sits in the narrative sections of a framework document, in the paragraph explaining why an indicator was chosen, in the contextual note a service manager added so nobody would misread their number. Organisations know why they believe what they believe. They file it as commentary instead of attaching it to the measure it justifies.
So this is recovery rather than creation, and it goes faster than anyone expects. Writing the claims down does two further things. It exposes indicators you don't have. You've claimed that something works in a particular way, and then find you've never measured whether it does. And it reclassifies indicators you do have: Once the claim is written, a measure you had filed under efficiency turns out to be telling you whether the thing works at all.
When a leadership team can't agree on a measure for more than two quarters, the problem is almost never the measure.
The instinct is to design harder: another workshop, another candidate indicator. It rarely resolves, because an indicator can't be agreed until people agree what it's evidence for. The first cause is that the causal claim was never stated. Where nothing states what a number is evidence for, every candidate looks arbitrary and reasonable people disagree indefinitely, because there's nothing to test a proposal against.
The clearest version of this shows up in a roll-up: an indicator used across several services. Ask whether up is good in all of them.
Take client turnover. In a hospital-to-home transition service, high turnover means the service is working and people are moving on. In supportive housing, high turnover means tenancies are failing. In justice case management the intent is retention, so flat is the goal. In a youth program where people age out, turnover is neither good nor bad, just structural.
Every one of those is correct at a service level. Add them together and you get a number that can't move in a good direction, because there isn't one. A rise means success in one service and failure in another, and the total conceals which. No amount of definitional tightening fixes that, because the definition was never the problem. Four different mechanisms are being summed, and the sum has no mechanism of its own.
There is a second cause, and it operates even when the causal chain is sound. People won't agree a number that's going to be used to judge them. That refusal isn't confusion. It's protection, and it's entirely rational: whoever signs up to the measure knows it will outlive the context that produced it, travel upward without them, and appear in a conversation they won't be in.
The two causes are easy to tell apart, and the test takes a minute. Ask the group to agree on the same measure on the explicit condition that it stays in the room and is never reported. Immediate agreement means the chain was fine and the obstacle was exposure. Continued stalling means the causal chain was genuinely missing.
Both are common, and they compound, which is why these conversations run for years.
What separated the performance systems that worked
The Michigan Keystone project drove bloodstream infections to zero across roughly a hundred intensive care units and held them there for a decade, which meant several thousand people went home who otherwise wouldn't have. New York State published cardiac surgery report cards, and surgeons began declining the sickest patients rather than risk their scores.
Same instrument, opposite results. Five conditions separate them:
- professionally owned
- embedded in improvement cycles
- used for learning rather than judgment
- paired with capability-building
- following evidence rather than substituting for it
These aren't a separate argument. They're the groundwork everything below depends on, and the full reasoning behind each is in the link.
A measure turns harmful when two things are true: something real depends on it, and there's a cheaper way to make the number look good than doing the work. Rankings make it worse, because someone always comes last, even when nobody is failing. Compare a result to its own history instead: its control limits, the normal range it moves in. Inside that range is noise. Outside it, a signal. That fixes the ranking problem, not the incentive. The number still has a consequence attached, and the only real fix is removing the consequence or making the honest route the easiest way to improve what's being measured.
Not a measurement problem, an evaluation-design problem
A measurement problem is one where you already know what to count and need to capture it reliably. Better integrations, cleaner data, a steadier reporting rhythm. More plumbing genuinely helps.
An evaluation-design problem is deciding what would make a result mean anything at all, and it has to be settled before any data exists. What's the comparison? Over what period? Which rival explanations have to be ruled out, and what evidence would rule them out?
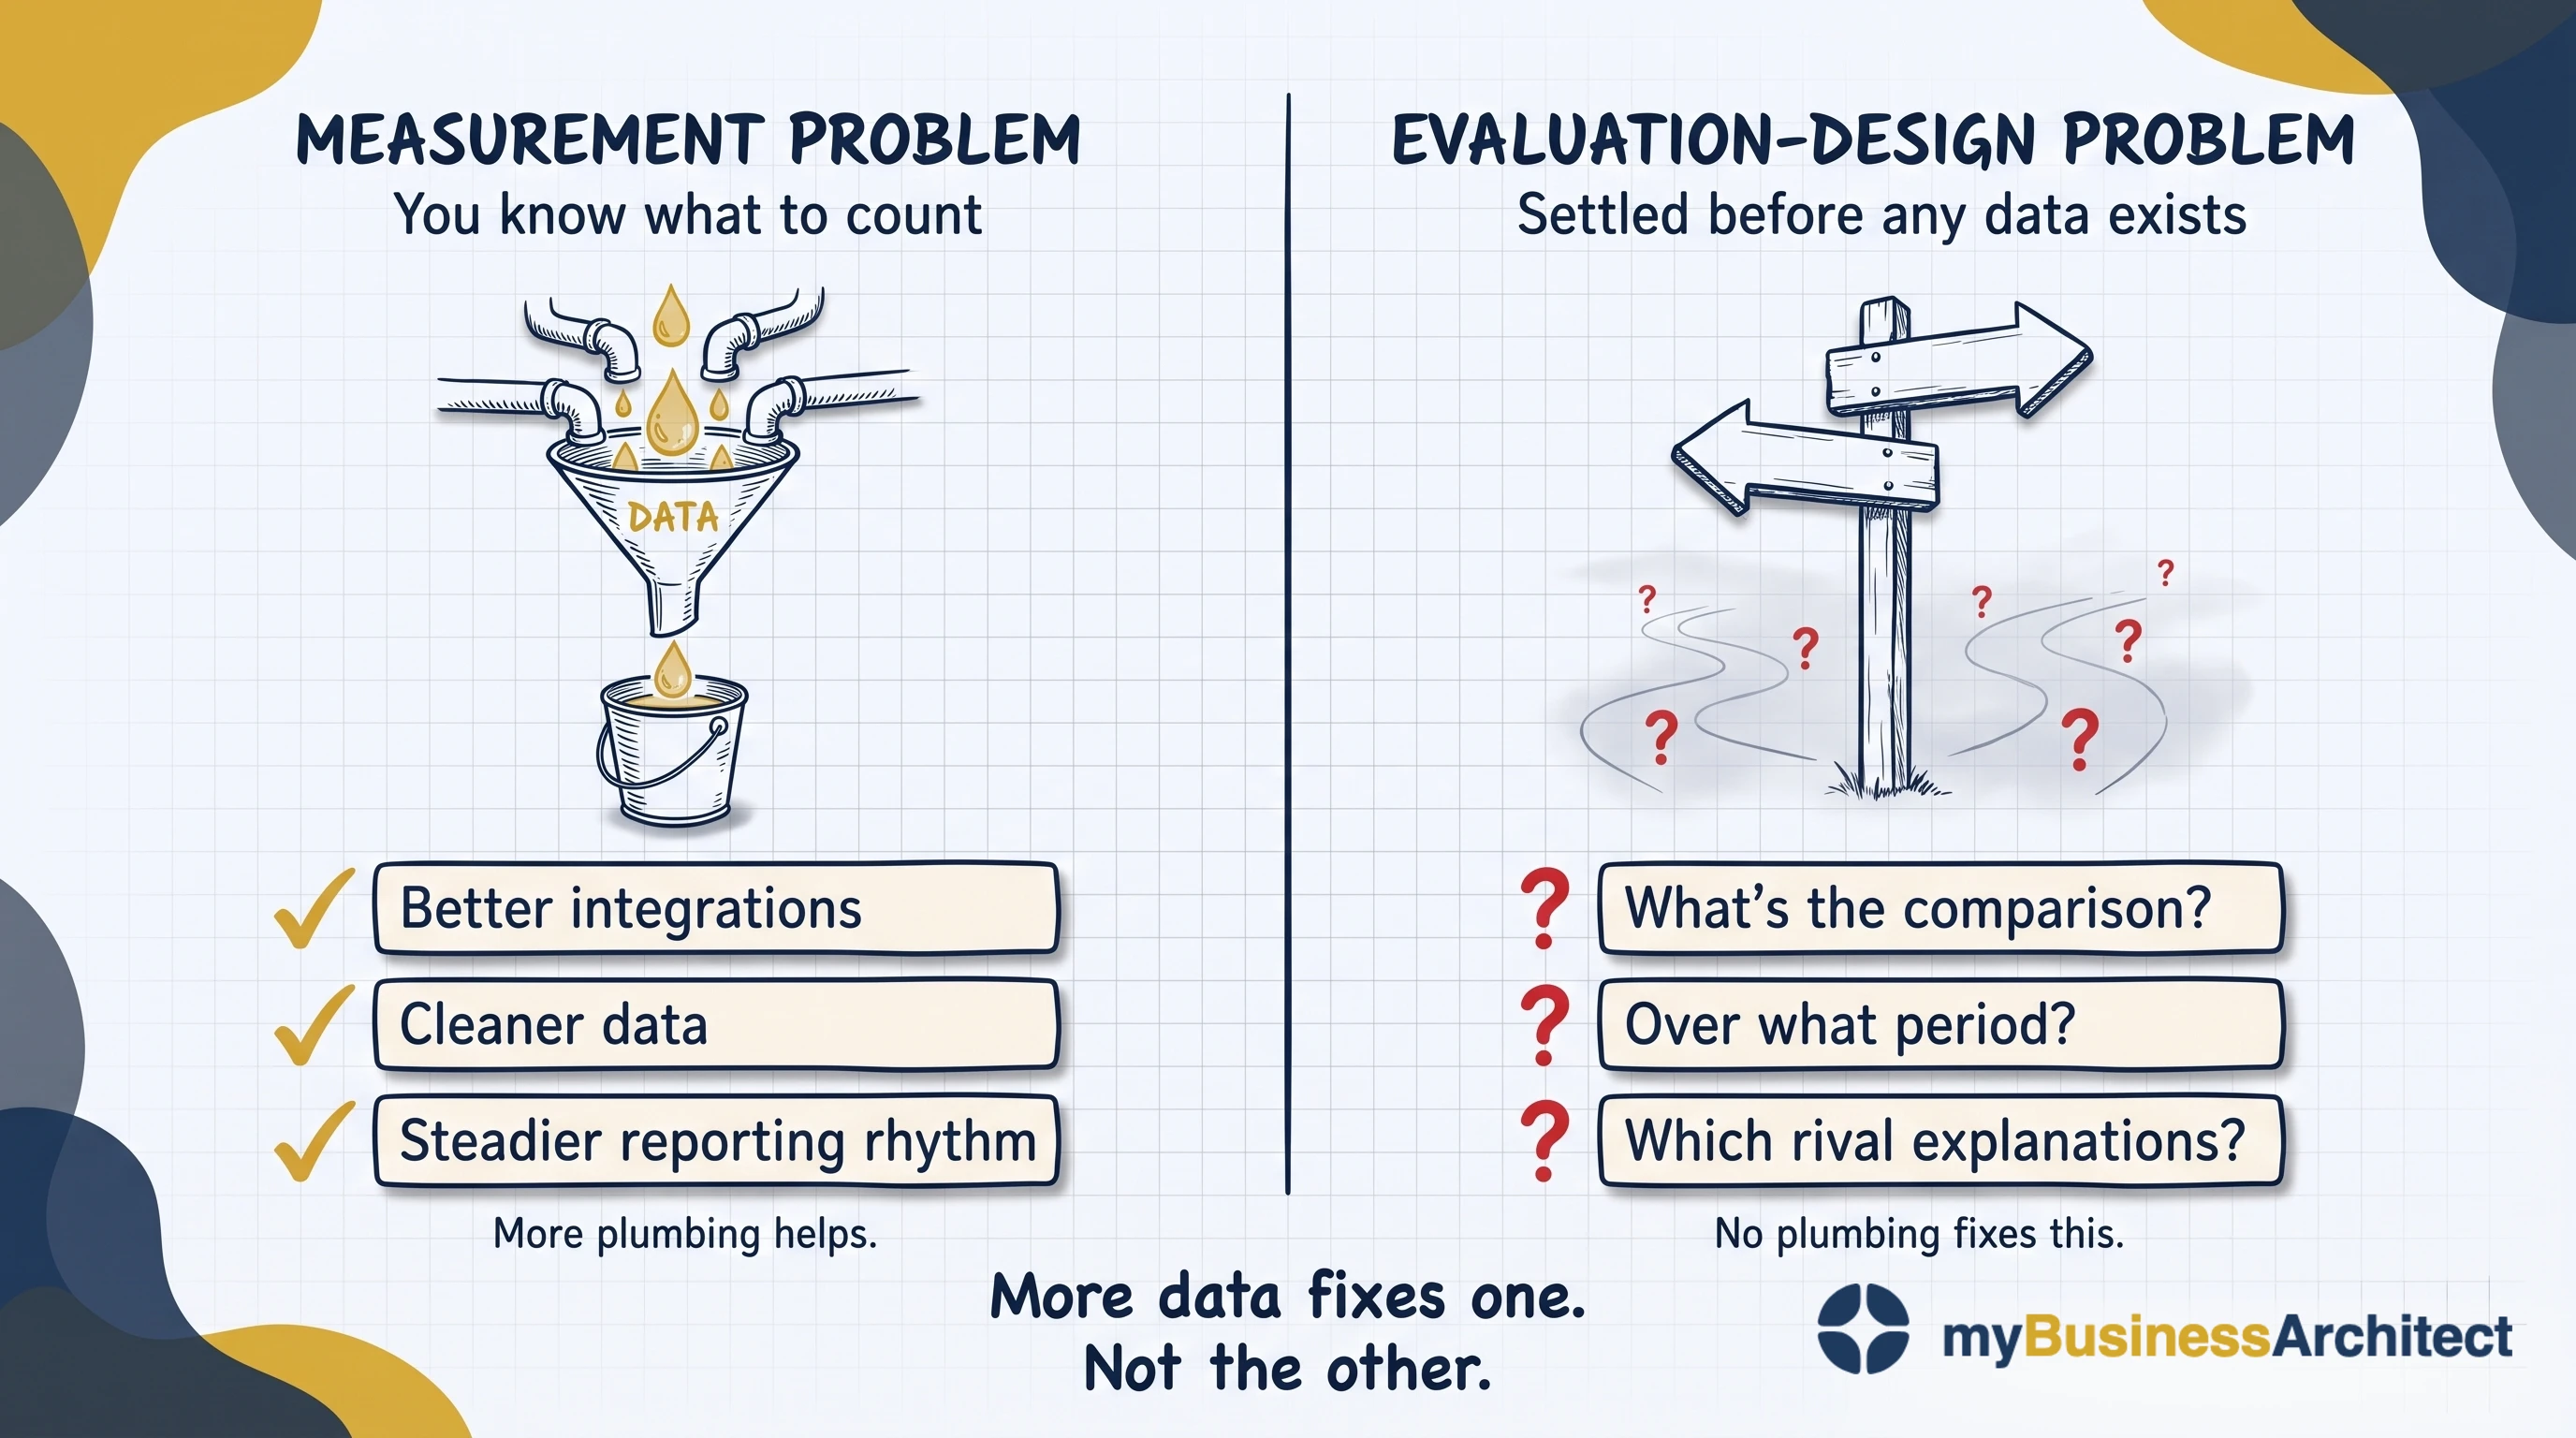
You can't collect your way to a counterfactual: what would have happened anyway isn't in anyone's systems, by definition. Most design decisions have to be made before any data is collected, and there's no going back to them later. A baseline nobody took can't be recovered at reporting time. And a weak design doesn't improve with more data. It gets more confident, which is worse. That's the failure mode modern analytics accelerates rather than solves.
This is why evaluators claim contribution rather than attribution: not "we caused this much of the change," but a verified causal story with its weak links declared. That isn't a lesser claim. It's the honest version of the same one, and it survives scrutiny.
All of which raises a question worth putting to anyone specifying a measurement regime, including yourself. Nineteen billion dollars has been given away in large, unrestricted grants with almost no reporting attached, and the recipients did at least as well on the funders' own outcome measures as organisations under conventional, heavily reported funding.
That doesn't make measurement worthless. It moves the burden of proof. Whoever asks for the reporting now has to say what it will improve, and many can't. Nobody designed the requirement. It just got copied from the last grant cycle.
Design problem, or a system protecting itself?
Here's the harder objection, and it may be fatal. Frameworks get adopted because a funder expects one, then run ceremonially. The logic model lives in the grant file, the indicators are reported on schedule, and the work happens some other way. Sociologists call this decoupling, and it's perhaps the normal state of performance measurement in the nonprofit and public sectors. It's invisible from outside and it looks exactly like success: full adoption, complete reporting, no effect on anything.
If systems run ceremonially because ceremony is what the situation rewards, then decoupling isn't a design failure. It's a rational equilibrium. Better architecture produces a better-architected ceremony, and no amount of design advice will change that.
That's a real rival explanation, and you can tell which situation you're in without appealing to anyone's intentions. Ask what happened the last time reported performance was bad. If the answer is a conversation, a change, and no punishment, the constraint is design and this work helps. If the answer is that nobody remembers reported performance ever being bad, the system is protecting itself, and no framework survives contact. In that case, the first piece of work isn't measurement design. It's changing what the funder asks for.
How to build a performance measurement framework
The first step is the one almost everybody does last, so the sequence matters more than the content of any single step.
1. Find the forum that can reopen a choice. If there isn't one, stop.
Not a reporting forum. A forum with the authority to look at the evidence and conclude that something the organisation decided is no longer supported by it.
This goes first because of what happens otherwise. You build the causal chain, choose the indicators, hold the reviews, and produce evidence that arrives somewhere with no power to act on it. The constraint was never measurement. It was decision authority.
Specify it before anything else is built. Who sits on it: the executive accountable for the outcome, the service owners whose causal claims will be tested, and someone who wasn't involved in setting the strategy. Four to six people, not the board, which reviews the review. What arrives: one page per live causal claim, its indicators, its direction of travel, and the service owner's written statement of whether it still holds. No presentation. Cadence: quarterly, and an existing meeting rather than a new one, or it's the first thing cancelled in a hard quarter. Decision rights: authority to retire an indicator, change a service, or record that a strategic choice is no longer supported by evidence. It can't change the strategy itself, but it can put a specific, evidenced challenge in front of whoever can.
When evidence and the budget cycle collide, which they will, the forum can't move money outside the cycle. What it can do is log the finding with a date, so the next planning round opens with a documented challenge instead of a blank page. That single mechanism is most of what makes the return leg real.
If nothing like this exists and can't be created, measurement design isn't your first problem. Building the forum is. Many organisations are already required to: the standards they already report against require exactly this.
2. Name who has to be better off. Specifically, as a group you could describe to a stranger. Not "the community". A named population with a describable situation.
3. State what better looks like for them, in terms they'd recognise. If they wouldn't recognise it, it's an organisational convenience.
4. Draw the causal chain, with arrows. One box per rung, from what you do to what changes for those people, and an arrow for every link you're claiming exists, each carrying the assumption it depends on. This is the step people skip by drawing tiers instead, because tiers don't require committing to anything.
5. Identify the capabilities each link depends on, and read honestly which of them you have. Links that depend on capabilities you lack are the real roadmap.
6. Find the link most likely to break, and measure that. Not one indicator per link: a causal chain fails at its weakest point, and instrumenting every link equally produces a dashboard where everything is amber and nothing is decisive. The link the claim depends on most and the one you trust least are usually the same link. Put your indicators there and accept that the rest goes unmeasured. Then test whatever you land on against five questions: who owns it, how often will they look at it, what happens to them if it's bad, can they act on what it shows, and does it detect drift or attempt proof?
7. Split the system by purpose, and understand why, or it won't survive its first challenge. The funder needs a number with a consequence attached; the front line needs one without, because that's what makes learning possible. The assumption that wrecks most frameworks is that these have to be the same number. They don't. Improvement measures go to the front line, weekly and granular; accountability measures go to the board, aggregated, few, and explicitly labelled. This isn't an argument against having a number to aim at. A benchmark is often the strongest evidence that something is achievable at all. Nobody believed zero central-line infections was possible until a hundred intensive care units did it.
8. Distinguish an aim from a target.
An aim is a predicted value derived from the causal claim: we think continuity above eighty per cent is where the mechanism holds, because below that the same case keyworker isn't present often enough to catch disengagement. It's a hypothesis with a number in it, and missing it is information about the claim.
A target is the same number with a consequence attached to missing it, usually written into a funding agreement or contract. At that point everything above applies. Two routes exist, one is cheaper than the work, and you've told people which to take.
So improvement measures carry aims and accountability measures carry targets, and the practical test isn't the number but what happens in the room when it isn't met. If the answer is a conversation about the mechanism, it's an aim. If the answer is that somebody has to account for themselves, it's a target, whatever the governance document calls it.
The statistical version is cleaner still. Rather than "reach eighty-five per cent," say: this runs at seventy-two with limits of sixty-five to seventy-nine, we think changing X shifts the whole distribution, and let's find out. That's aiming, it's testable, and a miss updates the claim instead of indicting a person.
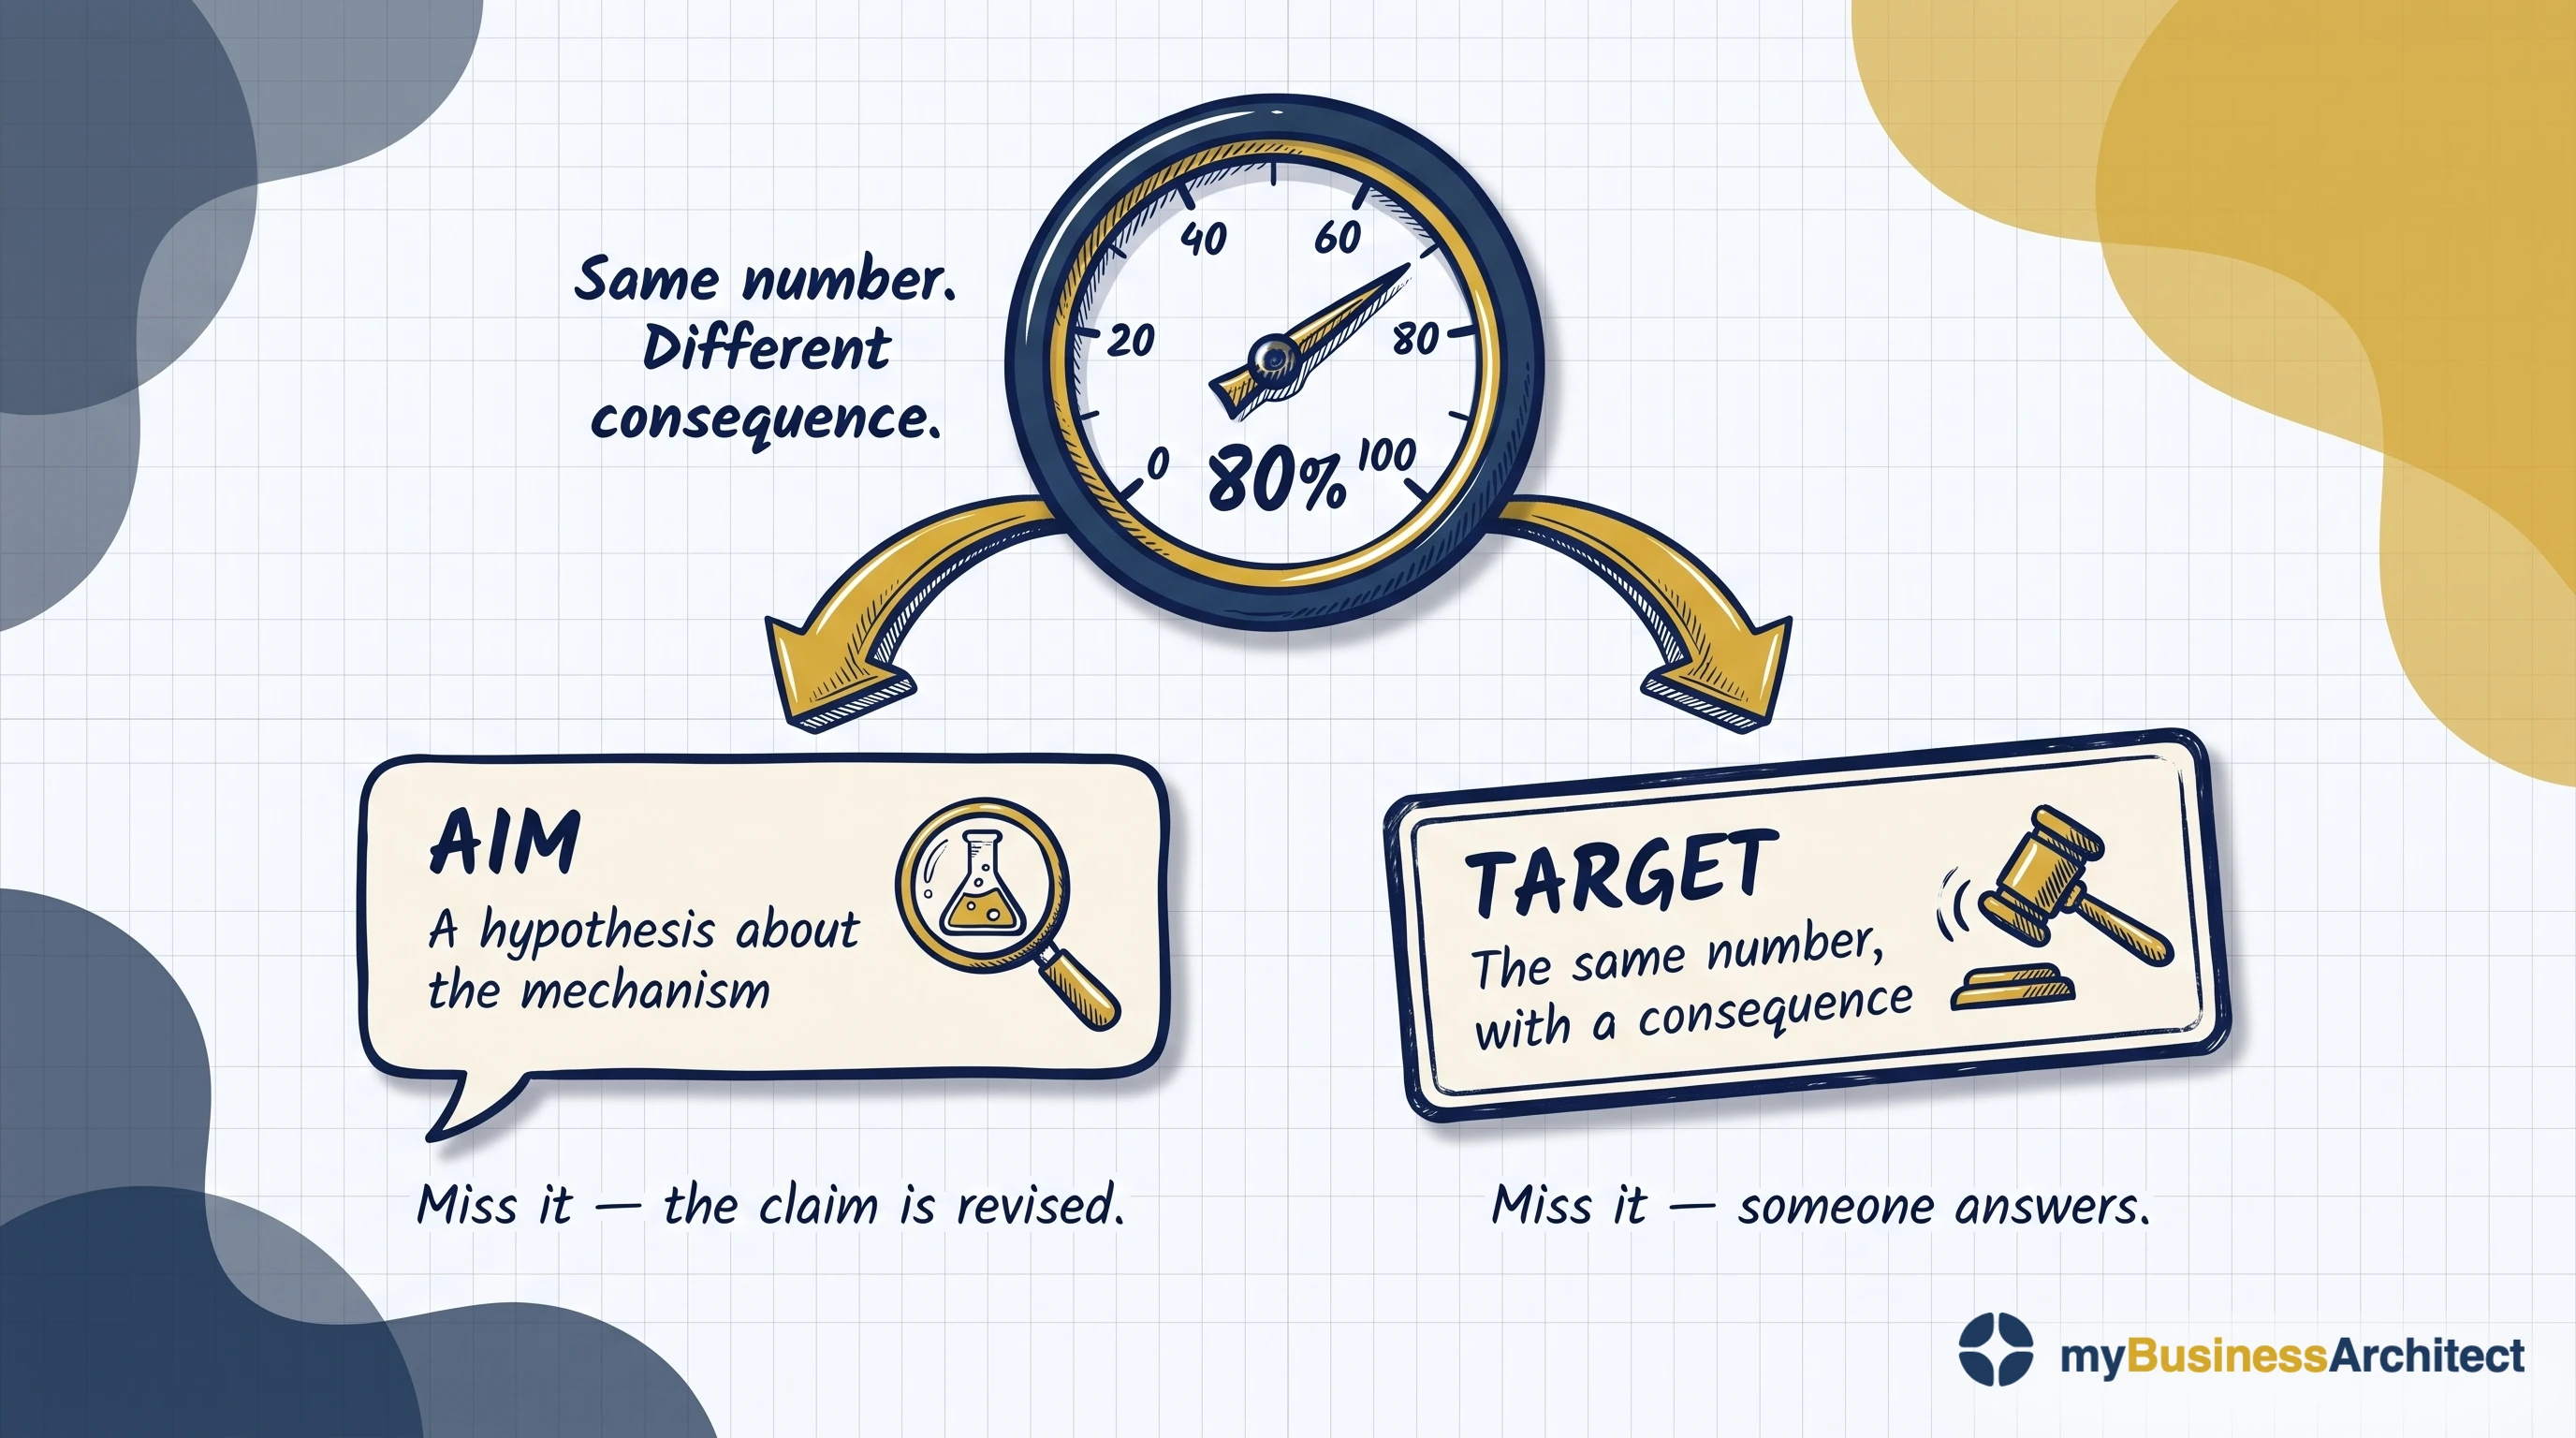
Expect to defend the split. Somebody senior will ask why there are two sets of numbers, and the answer is that the conflict was always there. It used to be resolved by letting accountability win.
All eight steps live in a model, not a document. In practice, that means the causal chains, their assumptions, the indicators, and the capability dependencies sit in the same place as your service definitions, versioned the same way, owned by whoever owns the service model. If nobody owns the service model, that's the first job, because a chain in a spreadsheet decays inside a year.
One causal chain, worked through
Consider an employment service, end to end.
The forum, before anything else. A quarterly service review already exists, chaired by the accountable director with both service owners attending, authorised to change a service or record that a strategic choice is no longer supported by evidence. Nothing below would have been worth building without it.
The strategic choice. Serve people with sustained unemployment and complex barriers, rather than the job-ready. Placement rates will fall, and that's the cost of the choice.
What better looks like for them. Not a job. Work that survives past the six-month point where this group has historically fallen out, and enough stability to plan more than two weeks ahead. A placement statistic tells you neither of those things. It records the moment someone started, which is the point at which this group's problems usually begin.
The capability it requires. Sustained relationship management over eighteen months, which the organisation doesn't have. Intake, matching, and placement are all built for short cycles. That gap is the actual investment decision, and it surfaced only because the choice was stated. Without that stated choice, the organisation would have bought a better matching system.
The service and the claim. A case keyworker model: one named person throughout, with a small discretionary budget. Sustained employment improves for this group because a consistent relationship catches the disengagement that precedes drop-out, and the discretionary spend removes the small practical barriers that cause it. Two testable assumptions, both capable of being wrong.
The indicators. Contact continuity and time-to-first-contact after a missed appointment are the leading indicators, both inside the organisation's control, both held as performance measures. Employment sustained at twelve months is a rung higher on the impact ladder, and it depends on a labour market nobody here influences. So it's tracked as contribution, never presented as a number the service earned alone. Continuity carries an aim of eighty per cent: the level at which the team believes the case keyworker is present often enough to catch disengagement. It comes from the claim, not from a funding agreement, so missing it starts a conversation rather than a consequence. The twelve-month figure goes upward, annually. Same framework, two systems.
And a quarterly question to the people themselves: has anything got better, and what?
What the review does when an indicator moves. Continuity drops and stays outside its control limits for two quarters, a threat to the causal claim, not the ordinary variation the old dashboard used to flag monthly. The finding: caseloads had risen after an unrelated referral-pathway change. The claim held. The capability had been quietly withdrawn. That went to the next planning round with a date on it. Placement rates fell too, exactly as the choice predicted, and this time nobody mistook that for a failure. The forum already had a stated reason on record for why chasing a harder population would cost throughput.
That's the return leg, running.
Where this doesn't work
Cascades fail where the expertise sits at the bottom. Hospitals and universities are professional bureaucracies: clinicians and faculty hold the knowledge, coordination happens through professional training rather than managerial instruction, and metric cascades are either resisted or followed in form only. That isn't a defect to fix with a better dashboard.
The sharper version of the objection is fair too. The value a physician creates with a patient is tacit and non-linear: judgment that can't be written down, applied to a relationship that doesn't improve in steady increments. Process abstractions flatten exactly that. Architecture can't model the therapeutic relationship and should stop implying it can.
Where this does work, the return leg runs through professional ownership: registries, peer review, clinical governance. Keystone worked because clinicians owned it. The condition isn't the framework. It's who holds the pen.
Four phases, four owners, and a return nobody owns
It's drawn as an adaptive cycle. Discover who you serve and what they need, Define the choices, Develop the capabilities, Deliver the result. Four phases, turning continuously, each pass better informed than the last.
In practice it's almost always run as a line. Discover, Define, Develop, Deliver, then a blank page next planning season.
Each phase has an owner, in the sense of who runs it, not who has final say: Leadership owns Discover, Strategists own Define, Architects own Develop, and Operations owns Deliver. But Leadership's ownership of Discover covers only the forward pass. The return, from Deliver back to Discover, has no discipline, no job title, and no budget line. So it rarely happens, and a cycle that never comes back round isn't a cycle.
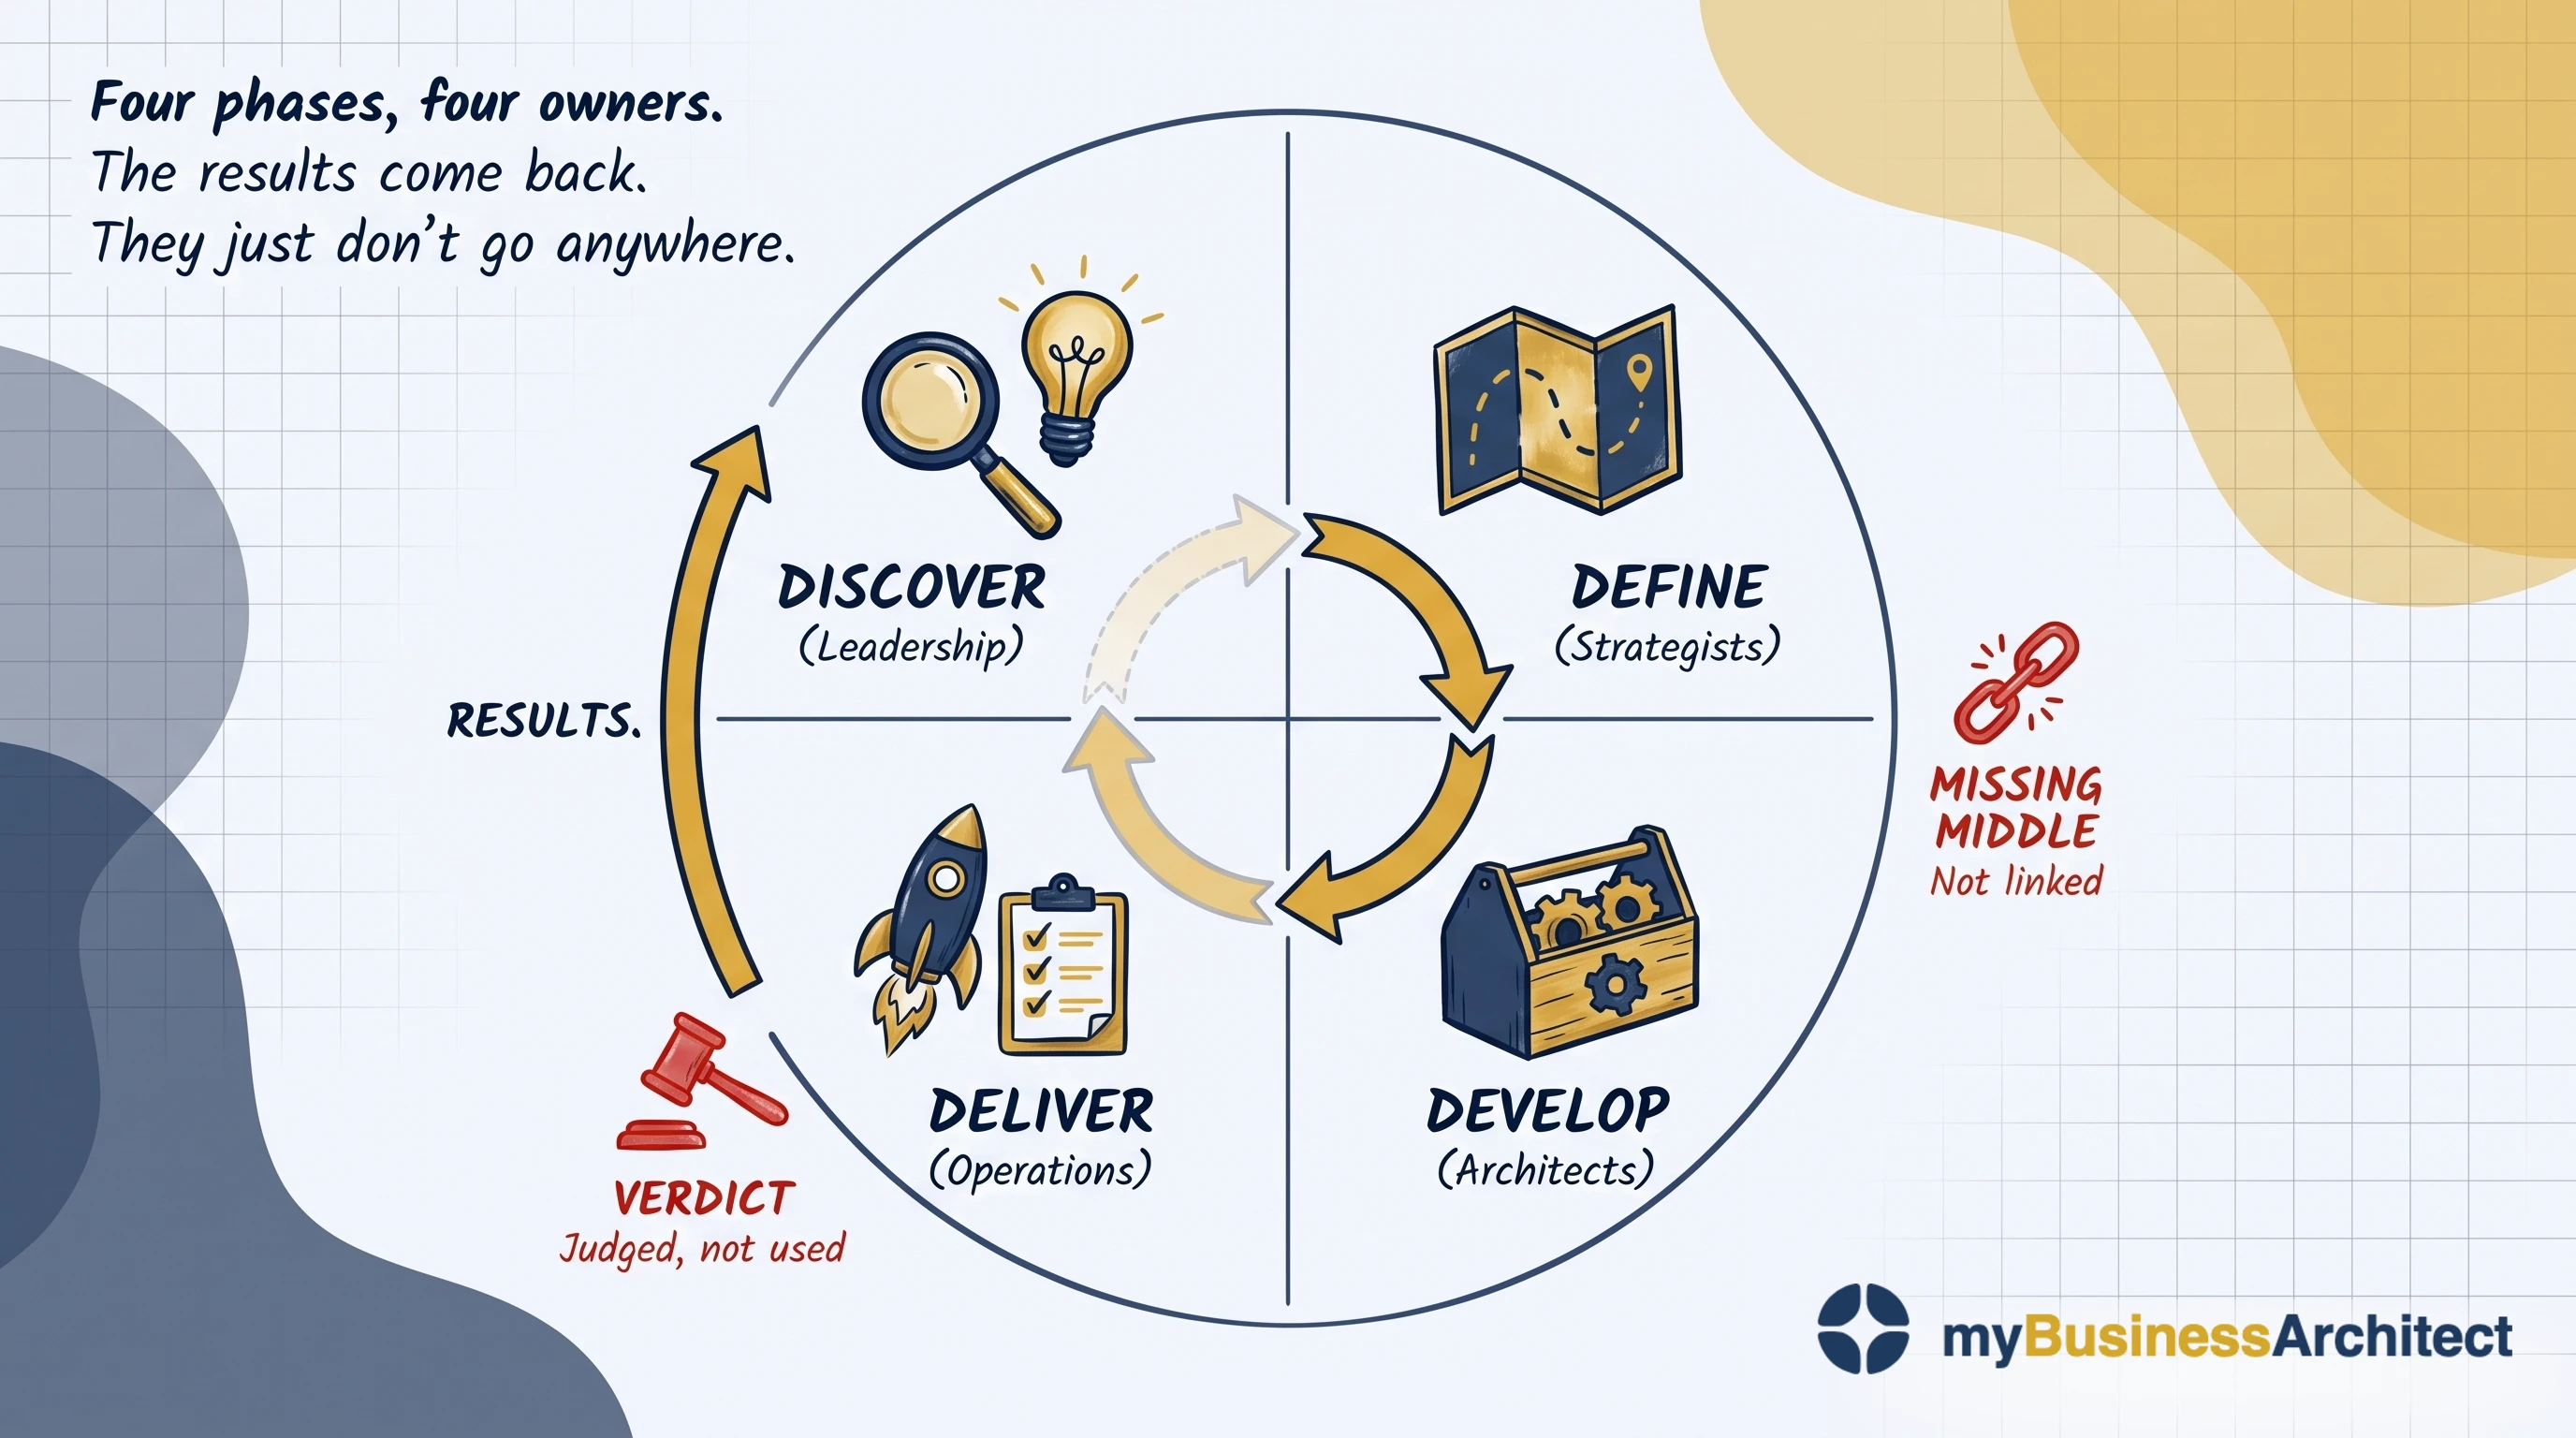
Two things break it: a lack of willingness and a lack of deliverability.
Willingness. Results do come back, upward to the same people who own Discover. But willingness has to be designed in before the moment it's needed: nothing on the way back was split by purpose, so what reaches leadership is accountability data by construction, aggregated, defended, carrying a consequence, built to answer who performed rather than what to adjust. That's the verdict the diagram stamps at the Discover/Deliver boundary: judged, not used. The question becomes who performed and who didn't, not whether the choices behind the work still hold. A verdict, once reached, consumes the result, and the cycle stalls at the point where it was supposed to turn.
Deliverability. Willingness isn't enough on its own. A strategy is only deliverable if its choices were connected to the capabilities needed to achieve them, and that same connection is where evidence has to land. Where the link was never made, a leadership team can genuinely want to learn and still have nothing to adjust, because nothing in the results points to the choice that needs revisiting. The result arrives, gets discussed, and nothing specific changes. That gap is the Missing Middle, seen from the other end.
Fix the verdict alone, and there's still no Missing Middle to carry the finding anywhere. Fix the Missing Middle alone, and the finding still arrives as a verdict. Fix both, and the cycle turns.
So the return needs what the forward pass already has: someone who runs it, someone who decides, and someone who answers for it, and they are not one seat. The executive whose unit the outcomes land in answers for the fourth question and chairs the forum that step 1 above specifies, which decides within that executive's authority and sends anything larger upward with a date on it. The service owners keep the model their claims live in, and the watchlist of assumptions under each claim, and write the page the forum reads. The business architect prepares the forum and sits on nothing: assembles the pages, keeps the dated log, carries a recorded challenge to the strategists who own Define, and when the same finding comes back a third time puts two real, costed options in front of the chair. The board reviews the review, with its own route to the outcome evidence. None of these is a new role. The return leg has no owner because the work was never arranged, not because nobody could do it.
What it comes down to
Go back to Jane, the woman referred in March, seen four times by June, closed as a completed case.
None of the above would have added a single field to her record. What it would have changed is what had to exist before that record was ever created: a causal claim about what those four contacts were meant to do for her, an indicator on the link most likely to fail, and a forum with the standing to conclude that the claim was wrong.
That isn't reporting. It's the difference between an organisation that can describe what it did for her and one that can say whether it helped, and know how it knows.
The payoff isn't better analysis. It's becoming the person in the room who can answer the question everyone else has learned to ask rhetorically, whether anyone is actually better off, and who knows what to do when the answer is no. There aren't many people who can, but it's entirely learnable.
Frequently Asked Questions
What is the framework for a performance measurement system?
A performance measurement framework defines what gets measured, why each measure exists, who owns it, and how results are used. In practice it has five rungs, often drawn as a ladder: inputs, activities, outputs, outcomes, and impact, from the ground up. Each answers a different question and needs a different kind of evidence. Most frameworks are crowded on the bottom two rungs and thin above them, because inputs and activities happen inside your systems while outcomes happen in someone's life.
What are the four types of performance metrics?
Most classifications reduce to four: input metrics (resources committed), process or activity metrics (what was done), output metrics (what was produced), and outcome metrics (what changed for the people served). A fifth, impact, is sometimes added for the share of change genuinely attributable to you. The critical distinction is between output and outcome, because the first is about the organisation and the second is about the person.
What makes a good performance measurement system?
Five conditions separate systems that work from systems that don't. Measures are owned by the people doing the work rather than imposed on them. They sit inside improvement cycles running weekly or monthly. They're used for learning rather than judgment, insulated from money, ranking, and career consequences. They come paired with the capability to act on what they reveal. And they follow evidence rather than substitute for it: they detect drift from something known to work, rather than trying to prove it works.
What is the difference between leading and lagging indicators?
Lagging indicators report what has already happened: graduation rates, readmissions, sustained employment at twelve months. Leading indicators signal what's likely to happen: early disengagement, contact frequency in the first thirty days. Most frameworks hold plenty of leading indicators of activity and almost none of outcome, which is why outcome drift is only ever discovered in an annual lagging measure, long after it could have been acted on.
How is this different from benefits realization?
The difference is duration. Benefits realisation asks whether a specific change delivered what it promised. It's bounded, it belongs to a program, and it ends when that program closes. Performance measurement asks whether the services you run every day are leaving anyone better off, and it never ends. Both ask the same governance questions about purpose, strategy, capability, and delivery. How you answer them is completely different, and when a program closes its benefits register closes with it, leaving the purpose question to nobody.
Continue learning
The business architecture framework sets out the four-phase cycle whose return leg breaks. Why OKRs fail is the same structural failure seen from the outbound journey. Benefits realization covers the bounded case. The service-oriented operating model puts outcome-accountability on the service, not the org chart. A performance measurement framework is where that claim gets tested, and outputs are not outcomes teaches the underlying distinction in full.
If you have decided to build one, the performance measurement guide is the workbook: eight phases, eight templates, and session designs for each.
When a Good Metric Still Isn't Evidence shows the output-outcome gap in a real, generalised working group: a metric everyone endorsed, and still no evidence anyone was helped.
In the cluster: what separates measurement that works sets out the full evidence both ways, nineteen billion dollars without a report asks whether funder reporting adds any value, accreditation is asking for architecture shows why two standards satisfied on paper are actually asking for connections, the first thing to go is curiosity takes the one free leading indicator of outcome, the claim held, the need moved covers the one thing a working framework still cannot tell you, and the thermostat is not the problem asks why the assumption underneath a measure is rarely questioned.
Closing the Strategy-Execution Gap teaches the connective work: the strategic choices, the chain, and the review that can reopen them.